Where Equity Trumps Revenue — RealRate’s 2026 U.S. Finance Services Rankings.
Introduction
The U.S. financial services industry encompasses a broad spectrum of firms — from global investment managers overseeing billions in client mandates to specialty impact funds channeling capital into underserved markets. Together, these organizations form the backbone of capital allocation in the American economy, shaping investment flows across every sector from infrastructure to healthcare.
Revenues among the sector’s publicly listed firms ranged widely in 2025, from Cohen Steers’ $556 million in advisory fees to Janus Henderson Group’s $3.1 billion in investment management revenues, reflecting a market where scale, specialization, and fee structures vary enormously. Yet size alone does not determine financial resilience — as RealRate’s 2026 rankings demonstrate.
RealRate’s 2026 rankings use the Economic Capital Ratio (ECR) to cut through revenue headline numbers and measure true financial strength. Based on audited balance sheet data for fiscal year 2025, the ECR divides a company’s economic value by its total assets — making comparisons fair across firms of vastly different sizes. The 2026 market average ECR for U.S. finance services is 78%, a sector where conservative leverage and clean equity structures are paramount.
2026 Rankings at a Glance
Trilinc Global Impact Fund LLC claimed first place with an ECR of 124% — 46 percentage points above the industry average of 78%. Cohen Steers INC held second with 122% (+45 pp above average), and Janus Henderson Group PLC ranked third at 117% (+39 pp). Federated Hermes INC completed the top four at 110%. Rankings were cross-checked between the HTML table at realrate-archive.com and the JSON source — both data sources confirm all values.
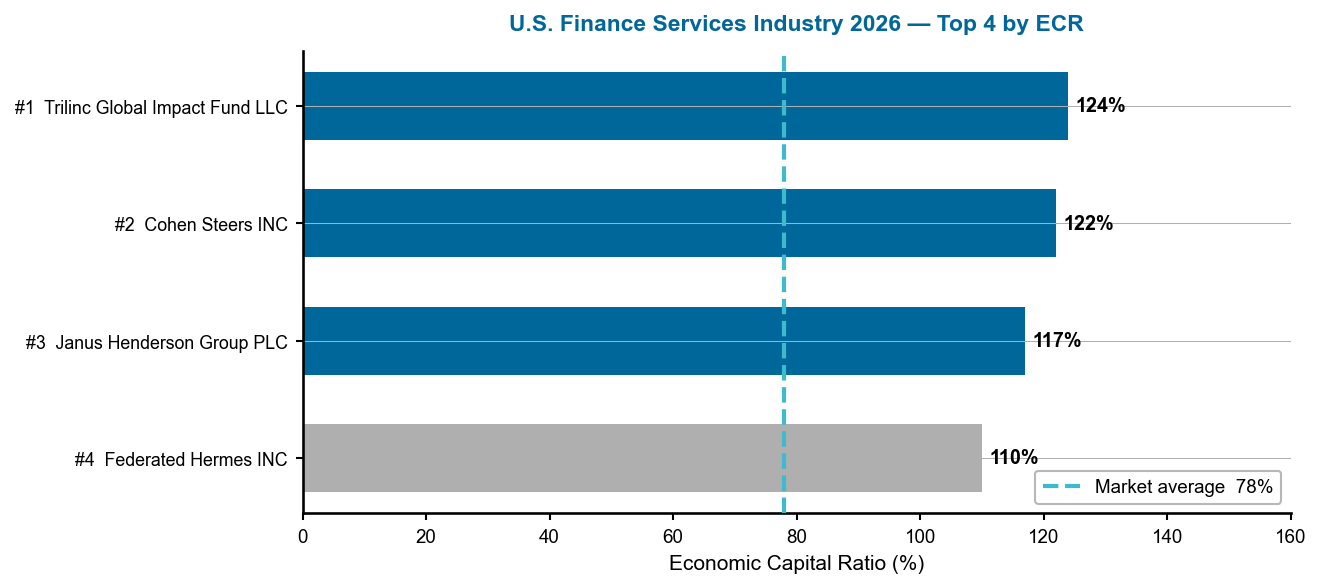
Figure 1 — U.S. Finance Services Industry 2026: Top 4 companies by ECR. Dashed line = 78% market average. Source: RealRate Archive (JSON, 2025).
Reading this chart: The horizontal bars show each company’s ECR; longer bars mean greater financial strength. All four companies clear the 78% market benchmark by a wide margin. The spread from Trilinc (124%) to Federated Hermes (110%) is 14 percentage points — illustrating how the leading firms are closely clustered in their capital strength, while remaining far ahead of the average.
A Multi-Year Story
The finance services rankings have seen meaningful turnover at the top over the past five years. Trilinc Global Impact Fund rose from rank 2 in 2025 (ECR 136%) to rank 1 in 2026 (124%), as competitors that led the table in prior years — including CNL Strategic Capital LLC, which topped the 2025 and 2024 rankings — did not qualify for the current year’s analysis. Janus Henderson made the most dramatic ascent, rising five positions to reach the top three — its ECR climbing from 111% in 2025 to 117% in 2026, driven by strong revenue growth and improved equity fundamentals. Cohen Steers, meanwhile, recovered from a dip to 117% in 2024 to post 122% in 2026, its best performance in three years.
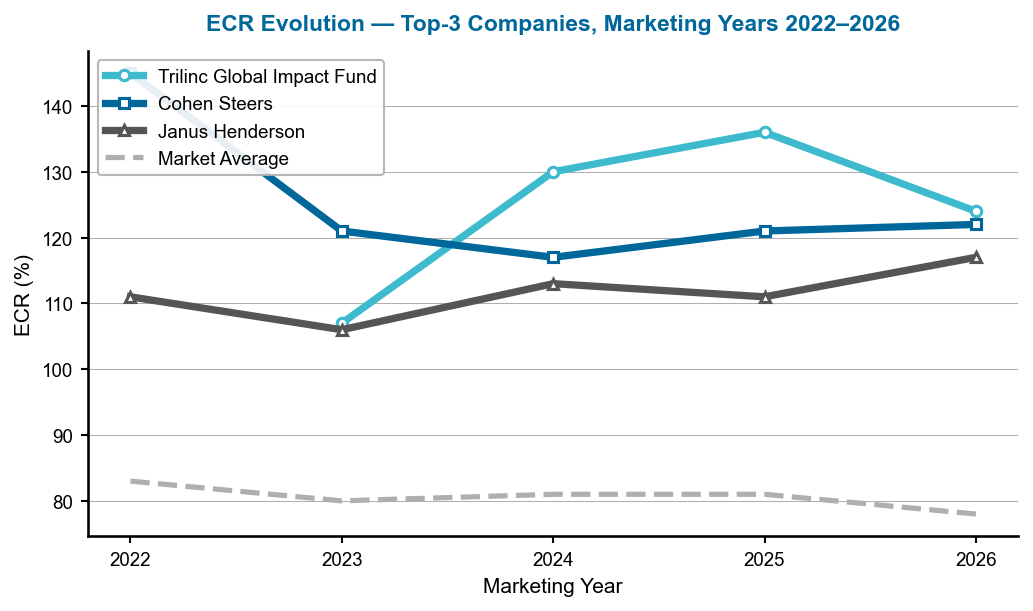
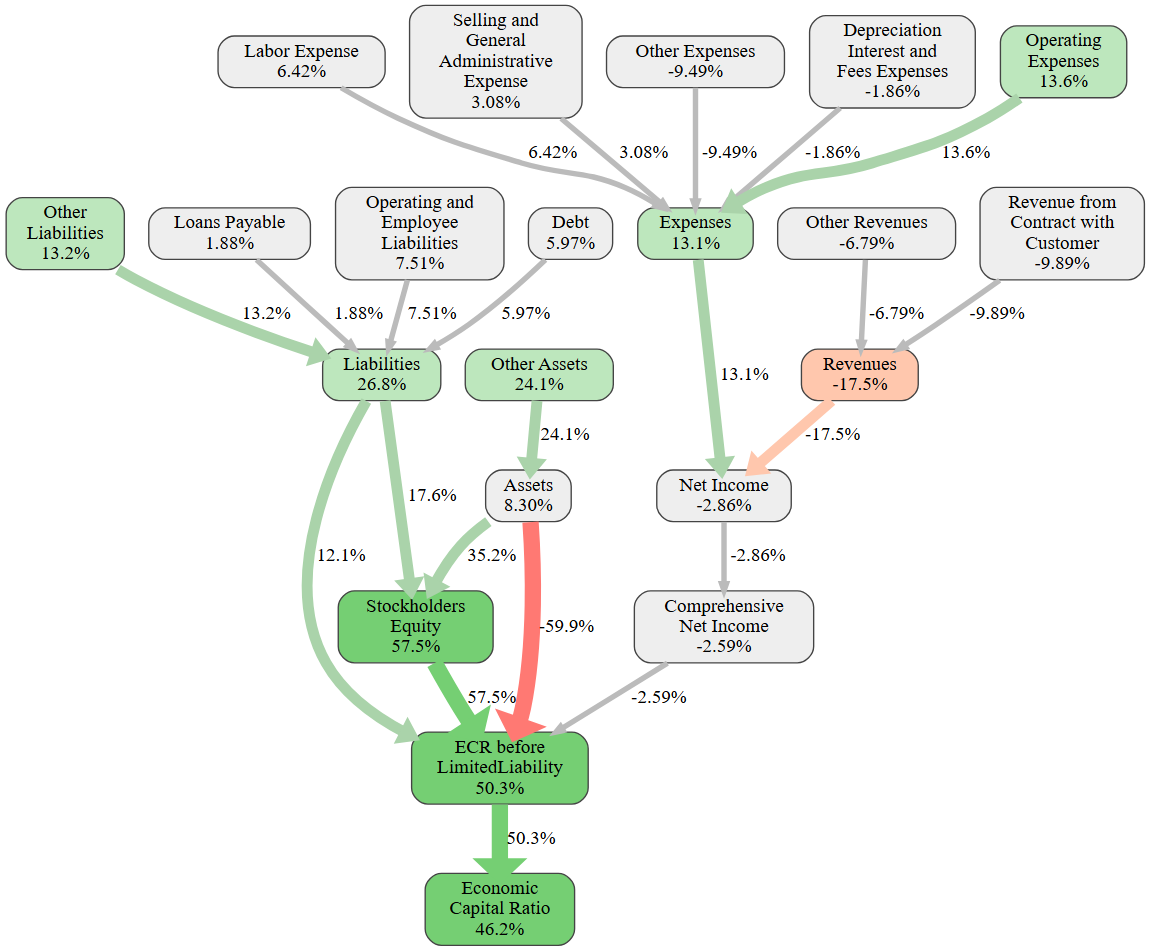
Figure 3 — Trilinc Global Impact Fund: causal ECR graph. Each node shows the effect (in ECR pp) of that variable versus the industry average. Green = positive contribution; red = negative. Source: RealRate Archive.
This causal graph reveals the mechanics of Trilinc’s top ranking with unusual clarity. The dominant positive node is Stockholders’ Equity at +57.5 pp — reflecting a balance sheet where equity represents 96% of all assets. The Liabilities node adds another +26.8 pp, as Trilinc’s near-zero debt is far below the industry average. On the negative side, Revenues (−17.5 pp) and Revenue from Contract (−9.9 pp) reflect the fund’s structural absence of traditional fee income. The net effect: an ECR 46 pp above the industry average. This is a company whose financial strength comes entirely from its balance sheet discipline, not its income statement.
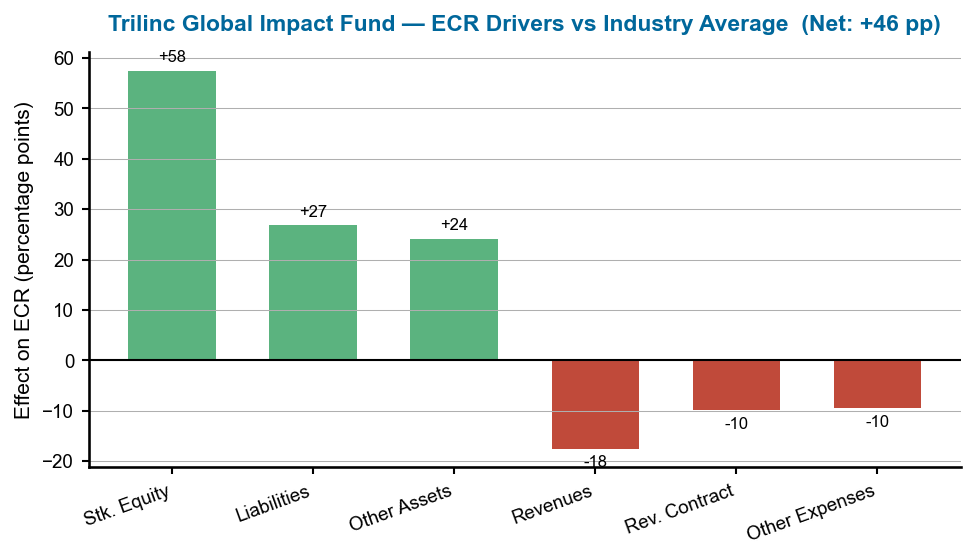
Figure 4 — Trilinc Global Impact Fund: ECR drivers versus industry average. Green bars = positive contribution; red bars = negative contribution. Source: RealRate Archive.
This bar chart makes Trilinc’s story impossible to miss. The towering green bar at +57.5 pp (Stockholders’ Equity) is the single largest positive effect in the entire industry ranking — the fund simply has more equity per unit of assets than any competitor. Liabilities (+26.8 pp) and Other Assets (+24.1 pp) add substantial further strength. The red bars — Revenues (−17.5 pp) and contract revenue drag (−9.9 pp) — are meaningful but cannot overcome the structural balance-sheet advantage. Net: +46 pp above the market average.
2. Cohen Steers INC — Real Asset Specialist Holds Its Ground
Cohen Steers is one of the world’s leading managers of real assets and alternative income strategies, specializing in real estate investment trusts (REITs), infrastructure, and preferred securities. With $556.1 million in 2025 revenues and net income of $157.4 million, the firm generates strong profitability on a lean asset base of $876.7 million. Its equity of $633.8 million against just $242.8 million in liabilities reflects a well-capitalized balance sheet that has underpinned consistent top-tier ECR performance.
Cohen Steers’ greatest ECR driver is its revenue structure: other revenues add 64 percentage points to the ECR — the largest revenue-side contribution among the top three. This reflects the company’s strong investment advisory fee income, which is high relative to its asset base. The primary drag is operating expenses (−21.4 pp), the cost of running a global investment platform with over 300 employees. The net result: an ECR of 122%, 45 pp above the market average — a mark of sustained excellence in capital management.
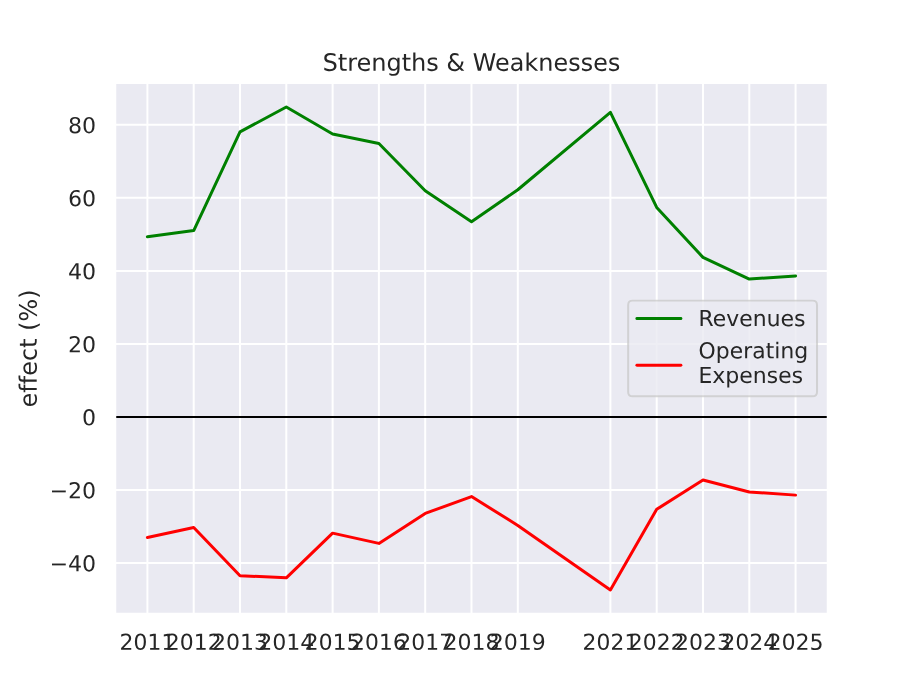
Figure 5 — Cohen Steers INC: ECR strengths and weaknesses over time. Positive values (green) boost ECR; negative values (red) reduce it. Source: RealRate Archive.
Cohen Steers’ strength and weakness profile over time shows a company whose revenue advantage has been persistently strong, while expense headwinds have fluctuated. The revenue-side contribution (Other Revenues) has been a structural positive for over a decade, reflecting the firm’s durable fee income stream from real asset management mandates. The expense drag has grown modestly in recent years as the firm has invested in talent and technology — a tradeoff it has managed well given the consistent top-three ranking across multiple years.
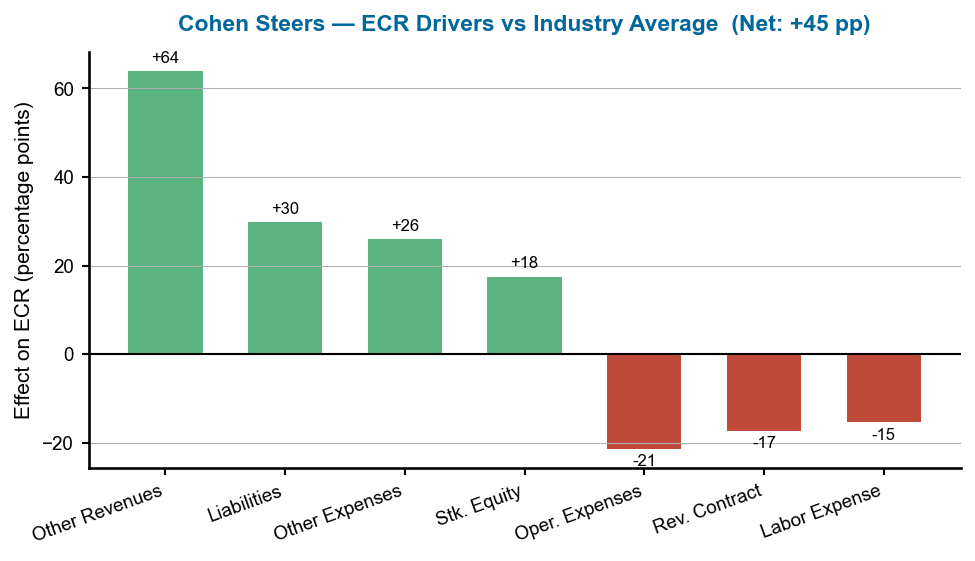
Figure 6 — Cohen Steers INC: ECR drivers versus industry average. Green bars = positive contribution; red bars = negative contribution. Source: RealRate Archive.
The effects chart for Cohen Steers tells a revenue-first story. The dominant bar at +64.0 pp (Other Revenues) dwarfs all other variables — reflecting a business model where high-value advisory fees generate exceptional income relative to the firm’s modest asset base. Liabilities (+29.8 pp) and Other Expenses (+26.0 pp) add further positive contributions, while Operating Expenses (−21.4 pp), Revenue from Contract (−17.3 pp), and Labor (−15.4 pp) are the main drags. The net +44.7 pp above market average confirms Cohen Steers as a structurally strong operator in the asset management space.
3. Janus Henderson Group PLC — Global Giant Makes Its Move
Janus Henderson Group is a global investment management firm overseeing approximately $370 billion in assets under management across equities, fixed income, and multi-asset strategies. With $3.1 billion in 2025 revenues — more than five times Cohen Steers — and net income of $907.6 million, it is the largest company in the top three by a significant margin. Its total assets of $8.3 billion are supported by equity of $6.1 billion, leaving a 74% equity-to-asset ratio that signals strong balance sheet discipline at global scale.
Janus Henderson’s most significant ECR improvement in 2026 came from revenue performance: other revenues contributed +32.6 percentage points, reflecting strong fee income growth as global markets improved and AUM recovered. Stockholders’ equity (+23.3 pp) and a disciplined liability structure (+22.7 pp) further reinforced its ECR. The main headwind is Other Expenses (−17.1 pp), the cost of operating a complex multi-jurisdiction platform. The overall ECR of 117% — 39 pp above the market average — and the five-place jump in the rankings confirm Janus Henderson as the year’s most improved major player.
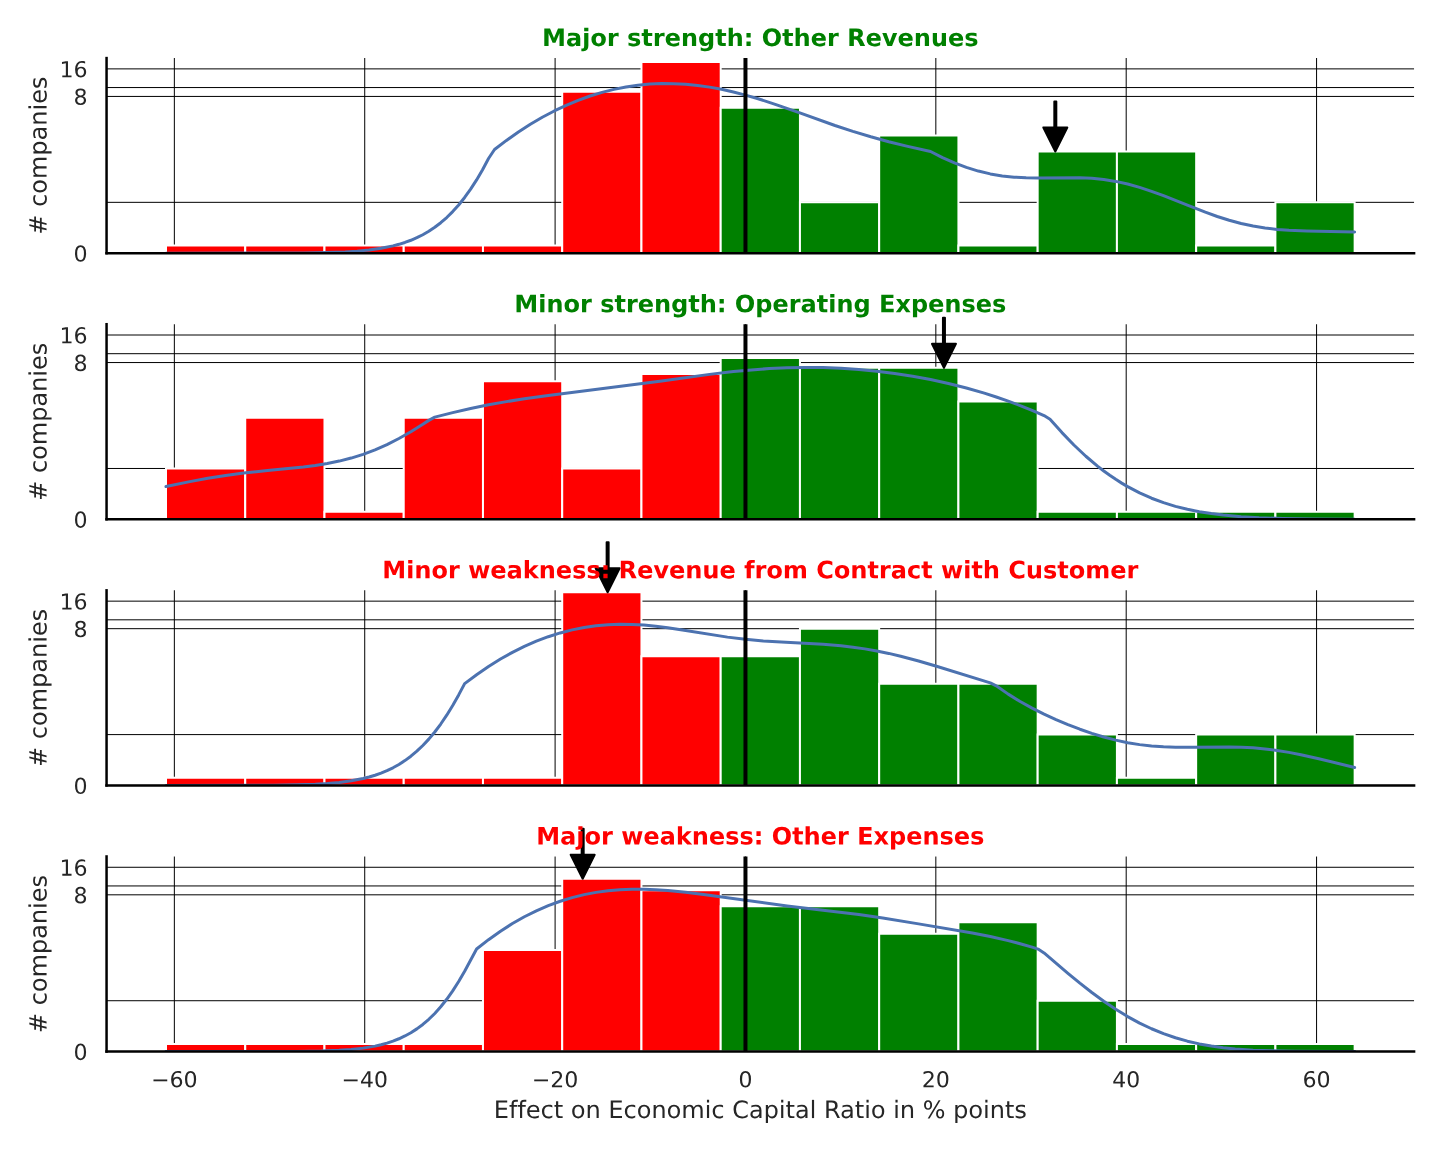
Figure 7 — Janus Henderson Group: feature distribution plot (black arrow = Janus Henderson’s position vs industry peers). Source: RealRate Archive.
This feature distribution plot shows how Janus Henderson compares to the full industry on each financial variable. The black arrow marks where Janus Henderson sits within each distribution bar. On revenue-related variables, Janus Henderson sits in the upper tail — consistent with its $3.1 billion revenue base, which is large relative to the average finance services firm. On liability variables, the firm occupies a middle position, reflecting a balance sheet that is conservative but not debt-free. The equity distribution shows Janus Henderson well above the industry median, confirming that its improved ECR and five-position ranking jump in 2026 are anchored in genuine balance-sheet strength, not a one-year outlier.
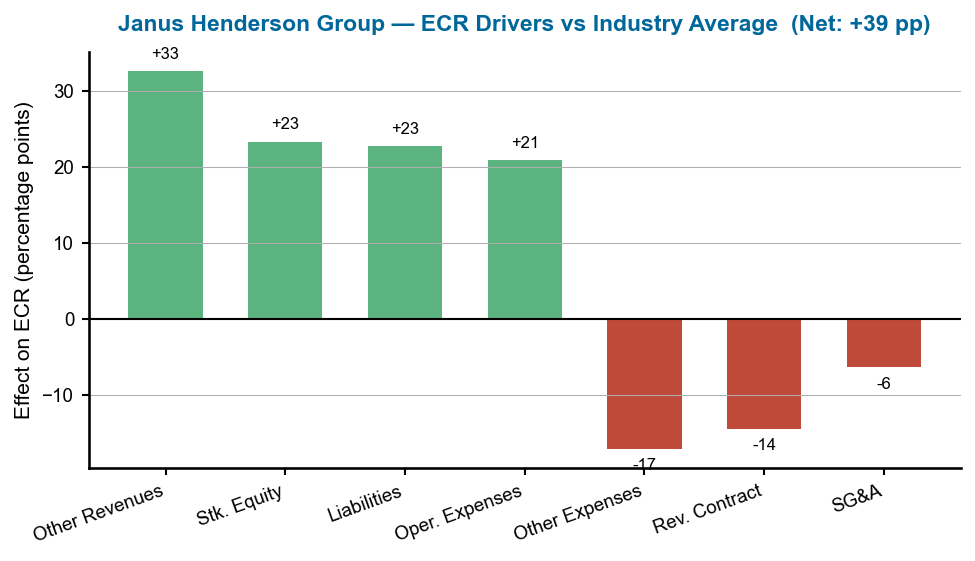
Figure 8 — Janus Henderson Group: ECR drivers versus industry average. Green bars = positive contribution; red bars = negative contribution. Source: RealRate Archive.
At Janus Henderson’s scale, the ECR driver chart reveals a balanced story. Other Revenues (+32.6 pp) leads, but the firm’s strength is spread across three pillars: revenues, equity, and liability management — all contributing meaningfully. Operating Expenses (+20.9 pp) is an unusual positive, suggesting Janus Henderson’s cost base is actually lean relative to the industry average for a firm of its size. Other Expenses (−17.1 pp) and Revenue from Contract (−14.5 pp) are the principal drags, reflecting the cost complexity of global multi-asset operations and fee compression in some mandate categories. Net: +39.1 pp above market average.
What Drives Financial Strength in Finance Services?
RealRate’s model identifies ECR before Limited Liability (87.9% importance), Liabilities (60.7%), and Stockholders’ Equity (56.6%) as the three most influential variables for ECR in U.S. finance services. The primacy of equity and liability structure — rather than revenues or net income — underscores a fundamental truth about financial firms: how capital is structured matters more than how much revenue is generated. A high equity-to-asset ratio is the single most predictive variable for financial resilience in this sector. Cash and current assets (31.3% importance) rank relatively low, suggesting that liquidity alone does not create lasting capital strength.
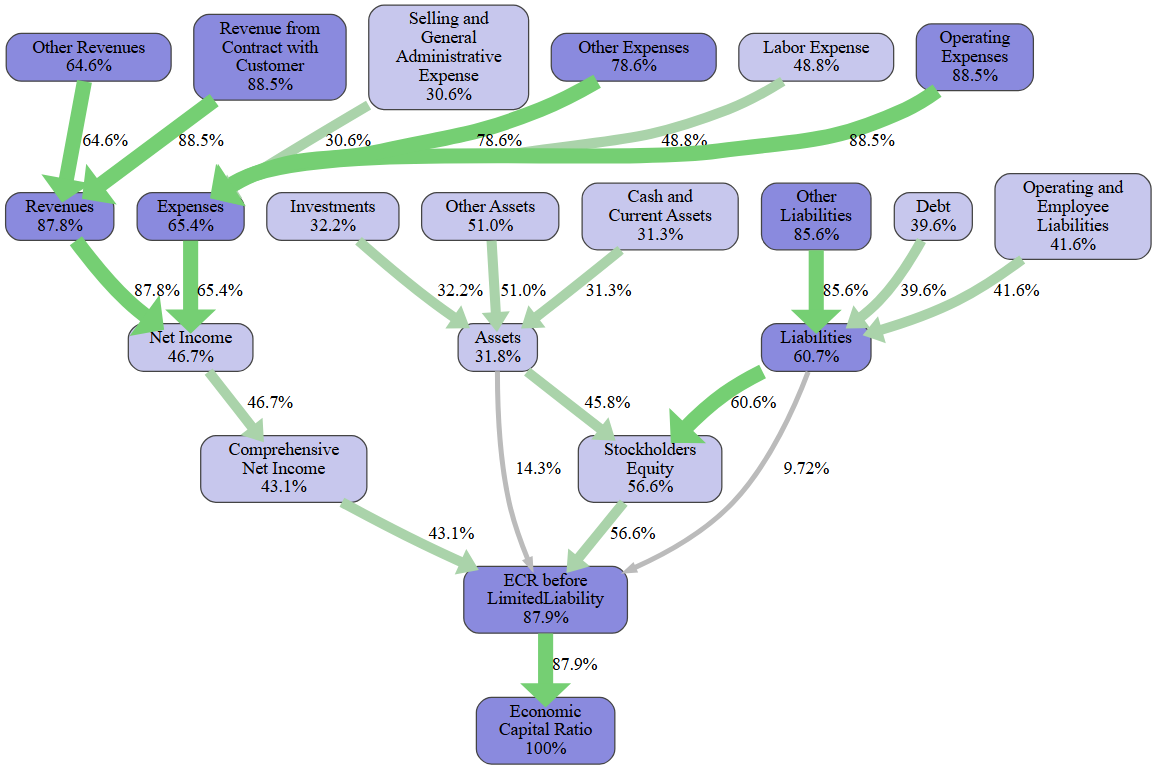
Figure 9 — U.S. Finance Services: feature importance cascade for ECR prediction (industry-level, no company arrow). Higher values = greater influence on the ECR model. Source: RealRate Archive.
This industry-level diagram (no black arrow identifying a specific company) shows the cascading importance of financial variables in predicting ECR across all finance services firms. The variables cluster into two groups: a high-importance tier (ECR before Limited Liability, Liabilities, Stockholders’ Equity — all above 55%) that drives most of the predictive power, and a lower tier (Net Income, Comprehensive Net Income, Assets, Cash) that adds incremental signal. The dominance of balance-sheet variables over income-statement items confirms that financial services firms are judged primarily on how they structure their capital, not how much they earn in any given year.
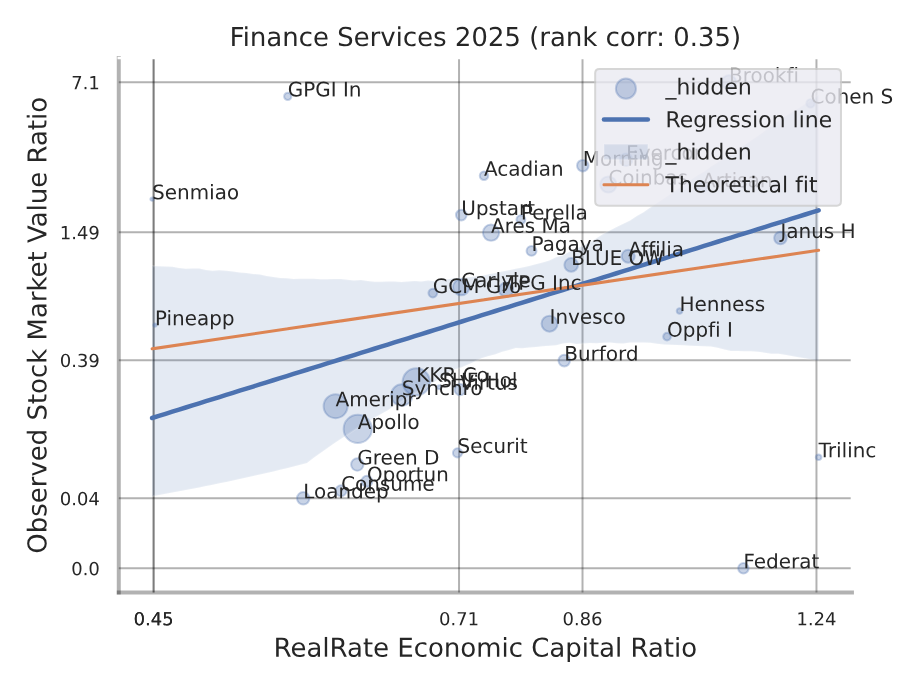
Figure 10 — U.S. Finance Services: backtesting correlation — RealRate ECR vs. observed market value ratio (industry-level, no red company dot). Source: RealRate Archive.
This industry-level scatter plot (no red dot, which would indicate a specific company) shows the relationship between RealRate’s ECR and observed market value ratios across all finance services firms. The upward slope of the regression line confirms that higher ECR scores correlate with higher market valuations — investors recognize balance-sheet strength. The dispersion around the line reflects the diversity of firm types: impact funds, asset managers, and diversified financials can trade at very different market multiples even at similar ECR levels. Overall, ECR is a meaningful and validated predictor of market value in this sector.
Market Statistics
The market average ECR for U.S. finance services firms in 2026 is 78%, down from 81–83% in 2022–2025. The downward drift reflects increasing competitive pressure, fee compression in asset management, and the entry of more leveraged business models into the tracked universe. The spread between the top performer (124%) and the market average (78%) is 46 percentage points — a wide gap that illustrates how significantly balance-sheet discipline differentiates the best from the rest. Companies that maintain high equity ratios and low leverage consistently dominate the upper decile of this ranking.
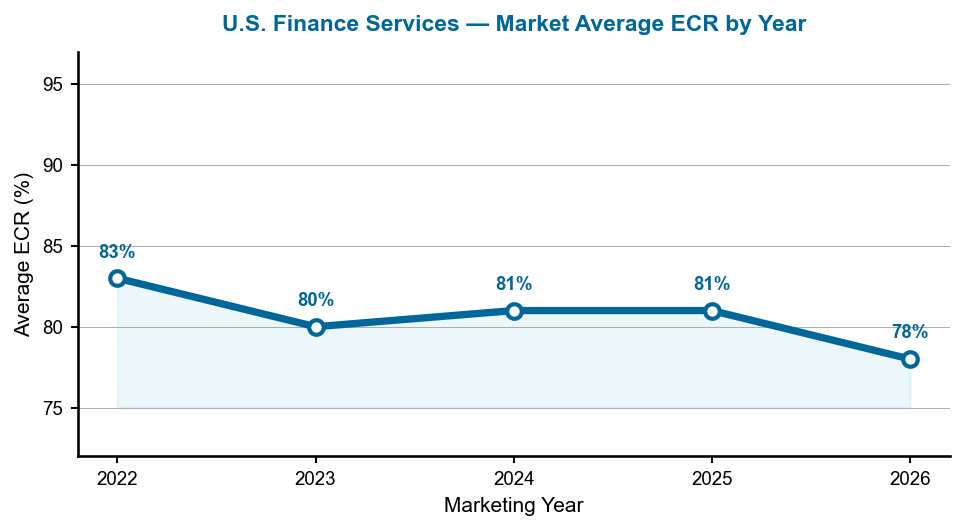
Figure 11 — Average ECR for the U.S. finance services industry, marketing years 2022–2026.
This line chart shows the market average ECR declining steadily from 83% in 2022 to 78% in 2026. The dip follows a period of market stress in 2022 (rising interest rates, volatile equities) that compressed balance sheets across the sector, followed by a brief stabilization in 2023–2025 and renewed pressure in 2026. For the top-ranked firms — all well above 110% — this widening gap between market average and leading ECR values reinforces their competitive moat: their balance sheet strength is structural, not cyclical.
Notable Movers
Janus Henderson Group is the headline mover of 2026, rising five positions to claim third place as its revenues improved and equity strengthened. Cohen Steers also moved up two places (from rank 4 to rank 2), recovering from a weaker 2024. Trilinc’s ascent to first place was partly a beneficiary of competitive reshuffling: CNL Strategic Capital LLC, which held the top spot in both 2024 and 2025, did not qualify for the 2026 dataset — leaving Trilinc to claim the crown on the strength of its unrivalled balance sheet. Bit Digital Inc, a cryptocurrency infrastructure firm that appeared at rank 3 in 2025, also dropped from the current-year analysis as its ECR profile changed. Federated Hermes INC is the notable new entrant at rank 4 with an ECR of 110%.
Manager’s Takeaway
The 2026 U.S. finance services rankings deliver a counterintuitive verdict: the most financially resilient firm in the sector has zero revenues and posts a net loss. Trilinc Global Impact Fund’s #1 ranking is a powerful reminder that the ECR measures capital strength — the ability to absorb shocks and generate economic value — not profitability in any given quarter. Cohen Steers and Janus Henderson demonstrate the revenue-driven path to capital resilience: strong fee income, lean balance sheets, and disciplined cost management. Across all three, the common thread is equity. In a sector where leverage is tempting and fee pressure relentless, the firms that protect their equity base, manage liabilities conservatively, and grow revenues faster than their asset base will consistently sit at the top of the RealRate rankings — year after year.