Where Balance Sheets Beat Billionaires — RealRate’s 2026 U.S. Food Industry Rankings.
Introduction
The US food and beverage manufacturing sector generates over $1.5 trillion in annual revenue, employs more than 1.7 million workers, and spans everything from artisan kefir producers to multinational meat processors. It is one of the most resilient — and fiercely competitive — industries in the American economy.
RealRate’s 2026 rankings use the Economic Capital Ratio (ECR) to measure true financial resilience. Based on audited balance sheet data for fiscal year 2025, the ECR divides a company’s economic value by its total assets — enabling fair comparisons across vastly different company sizes. The 2026 market average ECR for the US food sector is 140%, down from 148% in 2025 and recovering from the recent trough of 134% in 2024 — a period when rising commodity and labour costs weighed on balance sheets.
2026 Rankings at a Glance
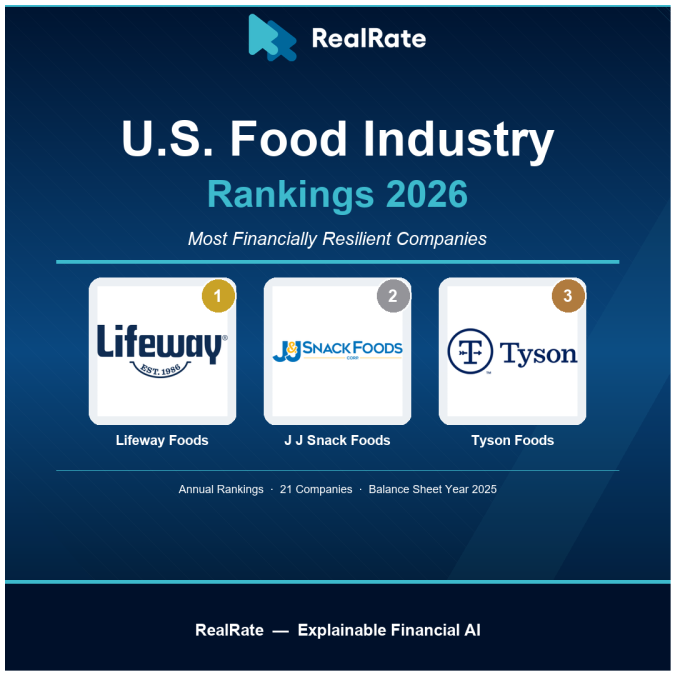
Lifeway Foods rose to first place with an ECR of 221% — 81 percentage points above the industry average. J J Snack Foods held strong at second (215%), while Tyson Foods secured third at 197%. All three comfortably outpace the 140% benchmark. The rankings were cross-checked between the HTML table at realrate-archive.com/us_food/qa/ and the JSON source at realrate-archive.com/us_food/2025/website-ranking.json — both sources agree on all values.
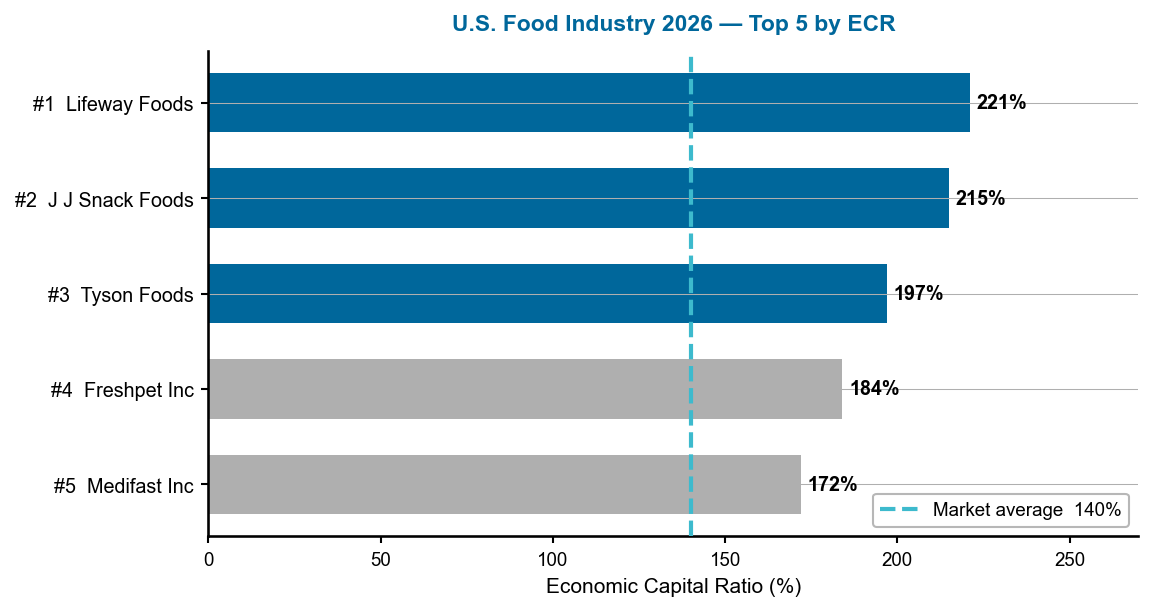
Figure 1 — US Food Industry 2026: Top 5 companies by ECR. Dashed line = 140% market average. Source: RealRate Archive (JSON, 2025).
Reading this chart: The horizontal bars show each company’s ECR; longer bars mean greater financial strength. The dashed line is the market benchmark — all five companies clear it comfortably, but the gap between Lifeway Foods (221%) and the fifth-ranked Medifast Inc (172%) is 49 percentage points, illustrating how much capital efficiency can vary even among the industry’s elite.
A Multi-Year Story
J J Snack Foods led the industry in marketing year 2025 with an ECR of 218% before Lifeway Foods overtook it in 2026 with a new peak of 221%. Tyson Foods ranked third in marketing year 2023 with an ECR of 220% — its highest in recent years — before slipping to an ECR of 189% in 2024, then recovering to 197% in 2026. Lifeway Foods itself was only ranked below the top-3 in 2022 and 2023, when its ECR dipped to 179% and 172% respectively, showing how swiftly fortunes can turn in a sector shaped by commodity costs, consumer trends, and input prices.
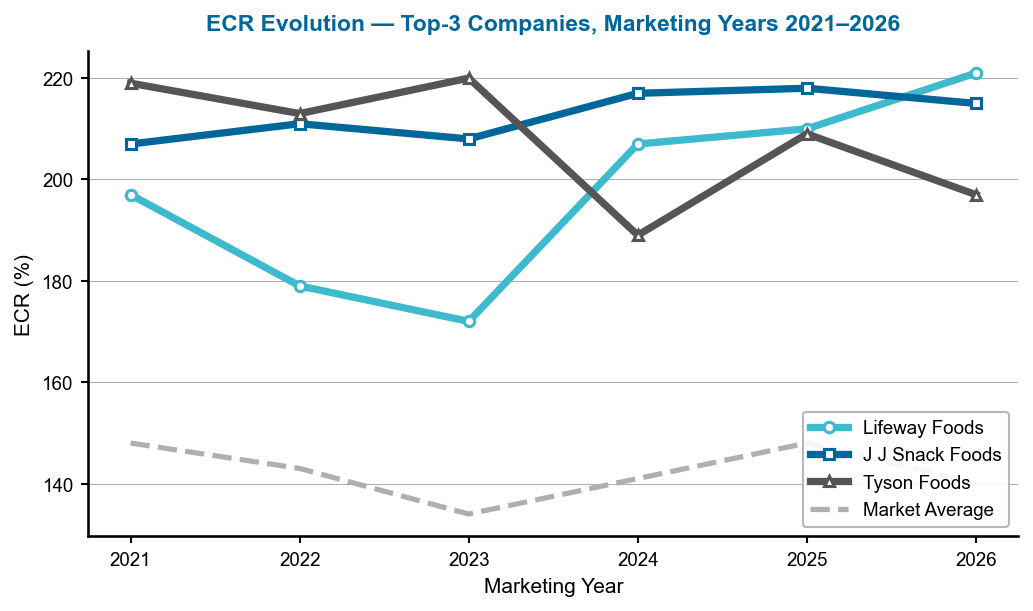
Figure 2 — ECR evolution of the top-3 companies, marketing years 2021–2026. Gaps indicate years where data were not available for that company. Source: RealRate Archive.
Reading this chart: Each line traces a company’s ECR across marketing years — rising lines signal improving capital strength. The dashed grey line is the market average. Notably, Lifeway Foods shows a clear upward trend since 2023, crossing above J J Snack Foods for the first time in 2026. The market average itself has recovered steadily since its 2022 dip, suggesting broader sector-wide improvement in financial resilience.
Company Profiles
1. Lifeway Foods — Kefir King at the Summit
Lifeway Foods is the United States’ dominant kefir producer, transforming a fermented dairy beverage into a mainstream health-food staple. Based in Morton Grove, Illinois, the company reported revenues of $212.5 million against expenses of $202.2 million in 2025, generating net income of $13.9 million. Total assets stand at just $105.6 million against liabilities of $19.8 million — leaving equity of $85.8 million, an exceptionally lean balance sheet that lies at the heart of its ECR strength.
Lifeway’s greatest ECR driver is its revenue performance: other revenues push the ratio 101 percentage points above the industry average — a remarkable achievement relative to its modest asset base. The main drag is expenses, which reduce the ECR by 65 points. The net result is an ECR of 221%, placing Lifeway 81 points above the market average and demonstrating that disciplined capital management at mid-size scale can outperform giants many times larger.
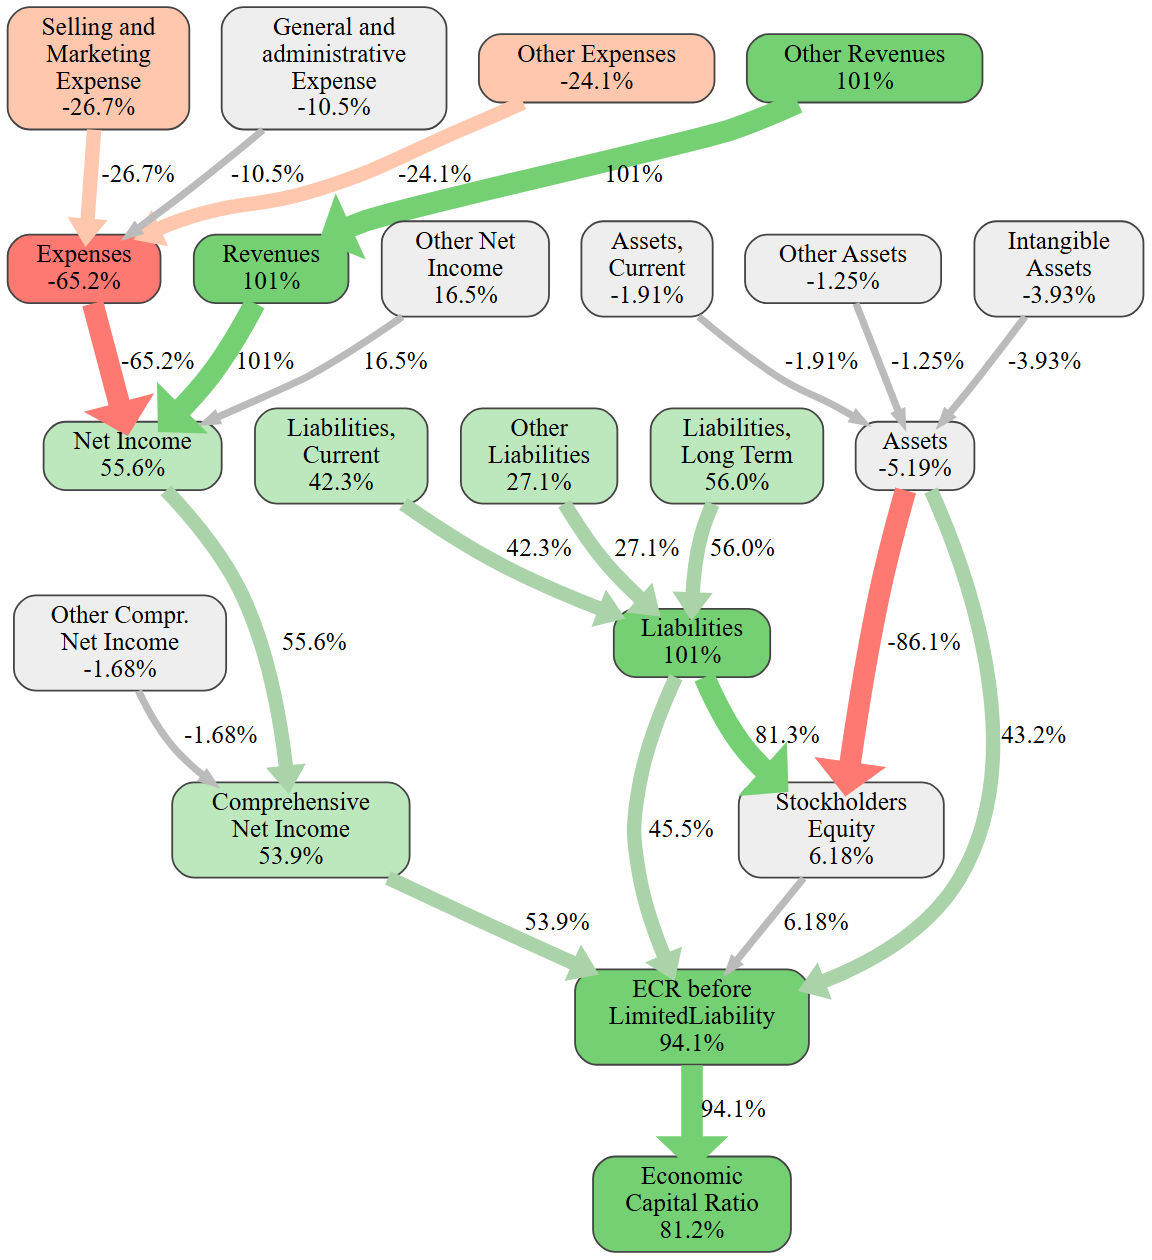
Figure 3 — Lifeway Foods: causal ECR graph. Each node shows the effect (in ECR %-points) of that variable relative to the industry average. Green paths boost ECR; red paths reduce it. Source: RealRate Archive.
This causal graph is the most revealing graphic for any company. Working from left to right, revenues at +101 pp and liabilities at +101 pp are the dominant positive nodes — both far above the industry average. Expenses at −65 pp is the single largest drag, reflecting Lifeway’s relatively high cost base for a company of its size. The final node shows the net result: an ECR 81 pp above the market average. The story is simple — Lifeway earns a lot for its size and keeps its balance sheet almost debt-free, which is a rare and powerful combination.
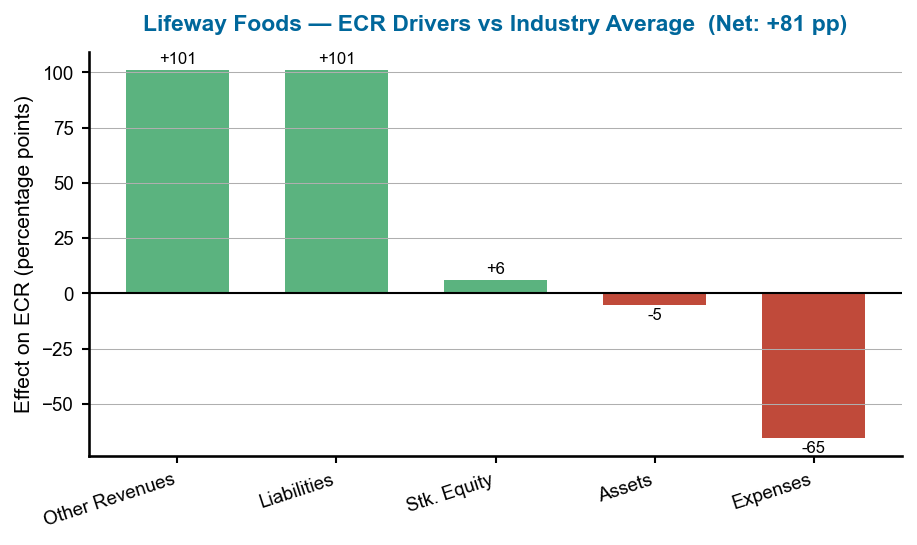
Figure 4 — Lifeway Foods: ECR drivers versus industry average. Each bar shows a variable’s effect on ECR in percentage points; green = positive, red = negative. Source: RealRate Archive.
This bar chart quantifies each financial variable’s contribution to Lifeway’s ECR relative to the industry average. Other Revenues is the standout positive driver at +101 pp — exceptional for a company of Lifeway’s modest size, reflecting premium product positioning and strong distribution reach. The Liabilities bar adds a further +101 pp, confirming the near-zero-debt balance sheet as an equal structural strength. The Expenses bar at −65 pp is the main counterweight, capturing cost base inflation in production and marketing. The net result of all effects is an ECR of 221%, placing Lifeway 81 pp above the market average.
2. J J Snack Foods — Snack Giant Keeps Its Grip
J J Snack Foods manufactures a broad portfolio of snacks and frozen beverages sold across foodservice and retail under brands including SuperPretzel and ICEE. Revenues of $1.58 billion and net income of $65.6 million reflect a well-run operation at scale. Total assets of $1.38 billion are matched against just $175.7 million in liabilities, leaving equity of $1.21 billion — one of the cleanest balance sheets in the snack food space.
The greatest ECR driver is its liability structure — low relative debt adding 70 percentage points to the ratio. Stockholders’ equity contributes a further 50 points. Expenses pull back 19 points, largely through distribution and marketing costs that come with a multi-brand national footprint. With an ECR of 215% — 76 points above the market average — J J Snack Foods demonstrates that brand scale and conservative leverage are a durable recipe for capital strength.
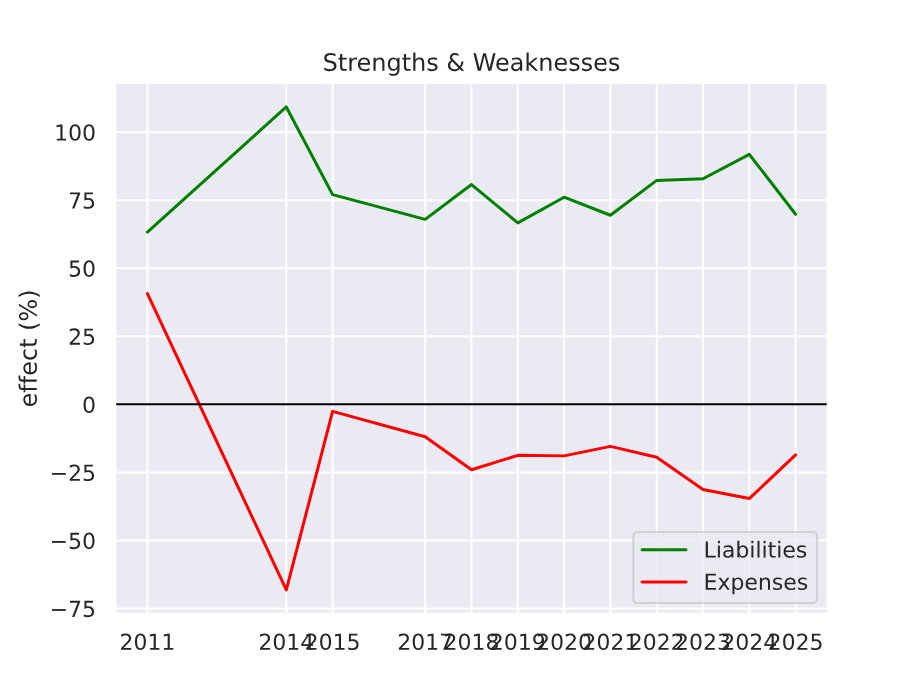
Figure 5 — J J Snack Foods: ECR strengths and weaknesses over time (2011–2025). Positive values (green) boost ECR; negative values (red) reduce it. Source: RealRate Archive.
J J Snack Foods shows a strikingly stable pattern over time: the liability and equity advantages have remained persistently positive across the observed period, while expense headwinds have been broadly contained. The consistency of this profile signals a business model with durable structural advantages rather than one reliant on short-term market conditions — a key reason the company has occupied a top-three position across multiple consecutive years.
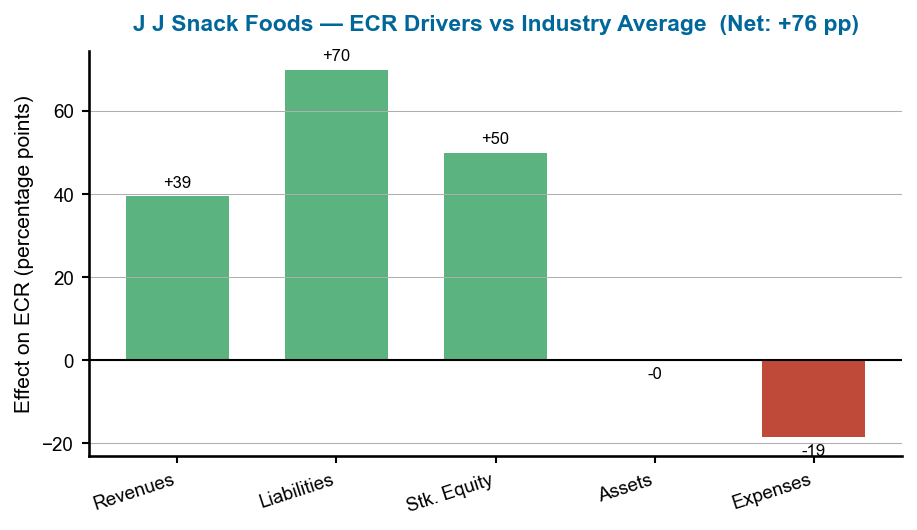
Figure 6 — J J Snack Foods: ECR drivers versus industry average. Each bar shows a variable’s effect on ECR in percentage points; green = positive, red = negative. Source: RealRate Archive.
The effects chart for J J Snack Foods confirms the twin-pillar story: liabilities at +70 pp and stockholders’ equity at +50 pp together account for the vast majority of the company’s ECR advantage. Revenues contribute a solid +39 pp — meaningful but secondary to the balance-sheet strengths. Expenses at −19 pp are the only material drag, and their modest size relative to the positive bars illustrates why J J Snack Foods has held the top-three position so consistently: its capital strength comes from structural, slow-moving variables that are unlikely to reverse suddenly.
3. Tyson Foods — The Protein Giant Holds Firm
Tyson Foods is America’s largest meat processor, with revenues of $54.4 billion in fiscal 2025. Its asset base stands at $36.7 billion, supported by a remarkably strong equity position of $30.3 billion — the result of years of retained earnings and balance sheet discipline. Operating in notoriously thin margins, Tyson generated net income of $507 million in 2025, while its current liabilities of $6.4 billion underscore the operational scale of its global supply chain.
Tyson’s greatest ECR strength is its liability structure — lean relative to its enormous asset base — contributing +76 percentage points to the ECR. Revenue performance adds another +59 points, reflecting the sheer volume throughput of a global protein company. The primary drag is operating expenses at −40 points, the unavoidable cost of running labour- and energy-intensive processing networks. The final ECR of 197% — 57 points above the market average — is an impressive result at Tyson’s scale and in its challenging margin environment.
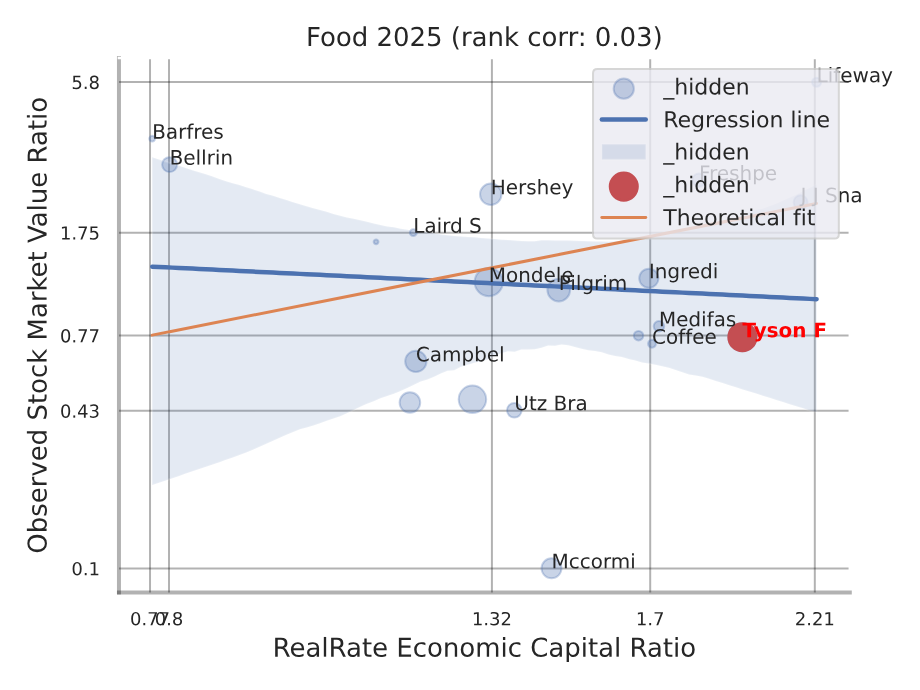
Figure 7 — Tyson Foods: individual backtesting correlation — RealRate ECR vs. observed market value ratio (red dot marks Tyson’s position). Source: RealRate Archive.
This company-specific scatter plot — identified by the red dot marking Tyson’s position — shows how well RealRate’s ECR model predicted Tyson’s actual market performance against the full industry backdrop. Tyson’s dot sits close to the regression line, indicating the market values the company broadly in line with what its ECR would predict. The tight clustering around the line across the industry confirms that ECR is a reliable predictor of market value ratios in the food sector, and that Tyson has not consistently traded at an irrational premium or discount — its valuation has reflected fundamentals.
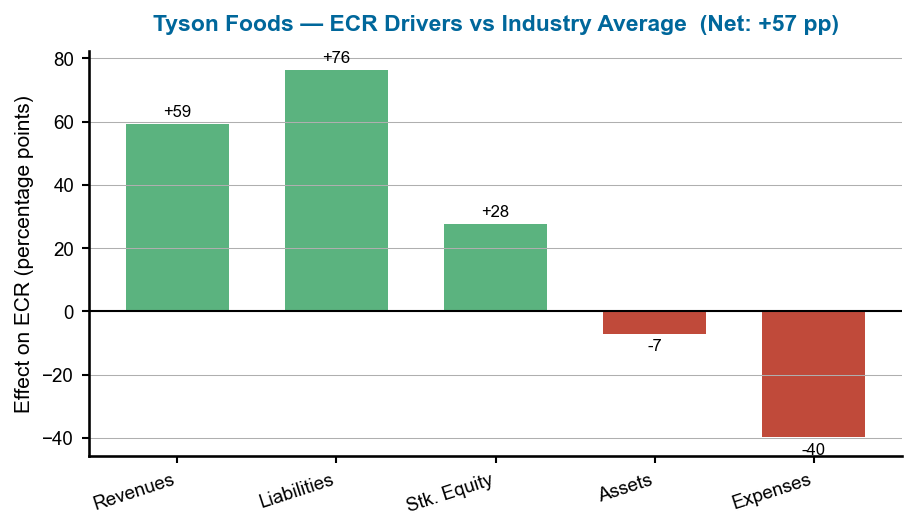
Figure 8 — Tyson Foods: ECR drivers versus industry average. Each bar shows a variable’s effect on ECR in percentage points relative to the sector. Source: RealRate Archive.
At Tyson’s scale, the effect bars reveal a deceptively simple story: liabilities at +76 pp and revenues at +59 pp do most of the heavy lifting. Both reflect Tyson’s ability to generate enormous revenue volume while keeping its relative debt burden lean against a $36.7 billion asset base. Stockholders’ equity at +28 pp confirms the strength of the $30.3 billion equity cushion. The expense drag of −40 pp is unavoidable at this operational scale — processing networks are energy- and labour-intensive — but remains modest given the positive contributions. The net +57 pp above the market average is a strong result for any company operating in notoriously thin-margin protein markets.
What Drives Financial Strength in Food?
RealRate’s model identifies liabilities (88.7%), operating expenses (84.6%), and long-term debt structure (84.0%) as the three most influential variables for ECR in the US food sector. It is not revenues or physical assets but how companies structure and manage their obligations that most separates the strongest from the weakest. Tangible fixed assets — property, plant, and equipment — rank among the weakest predictors (6.5%), reinforcing that capital-light business models dominate the top of the food-industry rankings.
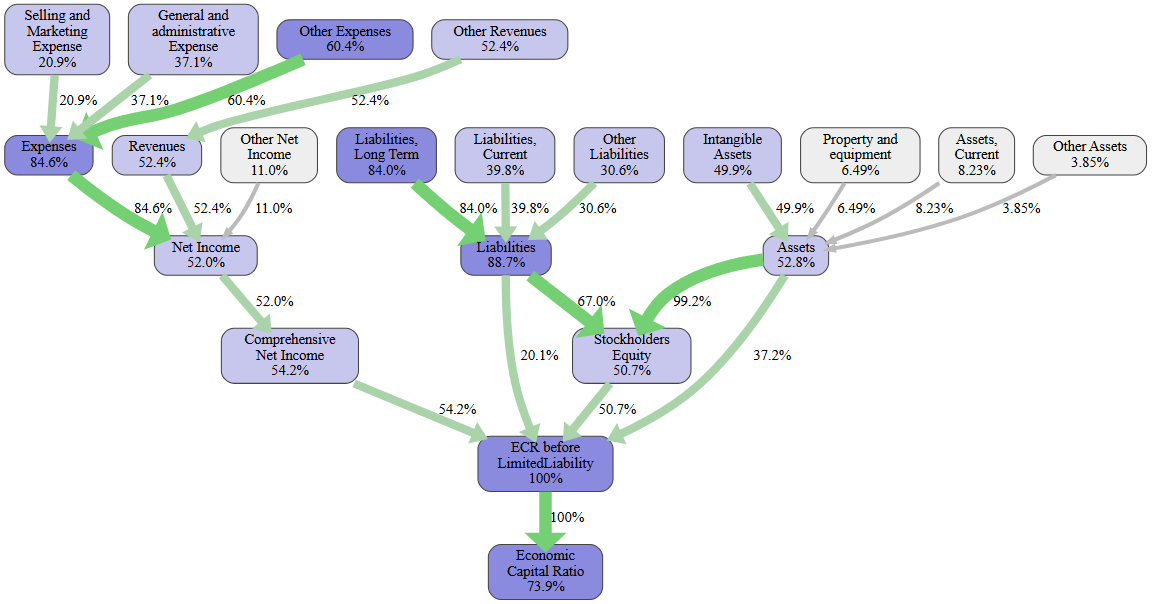
Figure 9 — US Food Industry: feature importance for ECR prediction (industry-level, no company arrow). Features above the 50% line are the primary ECR drivers. Source: RealRate Archive.
This feature importance chart is an industry-wide graphic (no black arrow) showing which financial variables most influence ECR predictions across all food companies. The three tallest bars — Liabilities, Expenses, and Long-Term Liabilities — all exceed 84%, meaning that a company’s debt structure and cost base are by far the most predictive factors for capital strength in this sector. Physical assets like property and equipment (6.5%) are almost irrelevant to the model, suggesting that investors reward balance-sheet discipline over capital investment. The clear threshold between the high-importance cluster (above ~50%) and the low-importance tail confirms that ECR in the food industry is driven by a small set of variables.
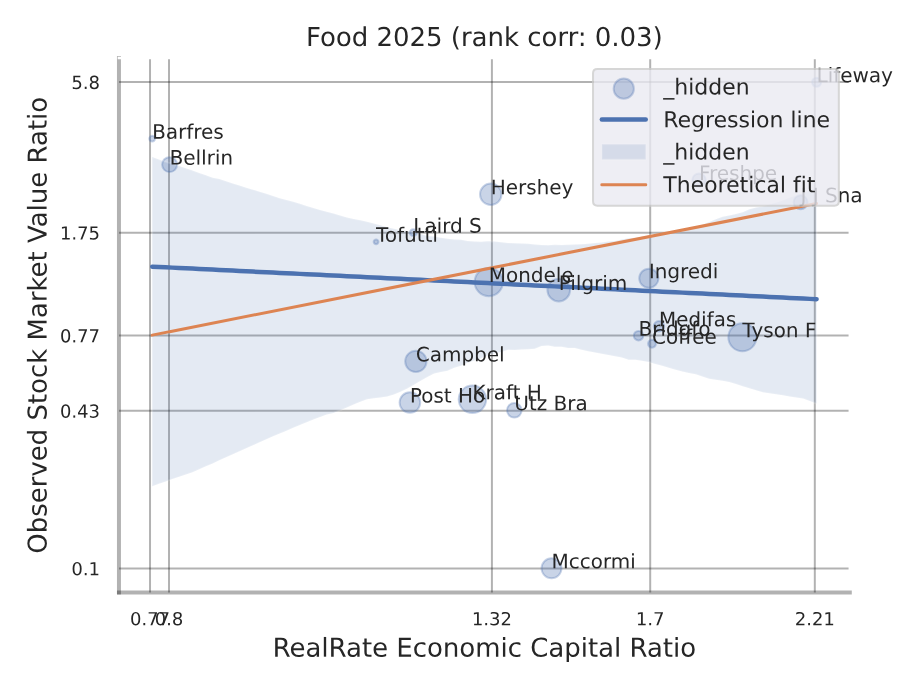
Figure 10 — US Food Industry: backtesting correlation — RealRate ECR vs observed market value ratio (industry-level, no red company dot). Source: RealRate Archive.
This scatter plot is an industry-level correlation chart (no red dot, as that would indicate a specific company). The X-axis shows the RealRate-calculated ECR; the Y-axis shows the observed market value ratio. The upward-sloping regression line confirms a positive directional relationship — companies with higher ECR scores do tend to attract higher market valuations. The dispersion around the line reflects the diversity of the sector: some companies, like Lifeway Foods, are valued below what their ECR might predict, while others trade at premiums reflecting growth expectations. Overall, the plot validates ECR as a meaningful financial signal for the US food industry.
Market Statistics
The average ECR across the 21 US food companies in 2026 is 140% — down from 148% in 2025 but recovering from the recent trough of 134% in 2024. The wide dispersion between the top performer (221%) and the sector’s bottom (below 1%) reflects the structural diversity of the industry, from kefir specialists to global meat processors. The multi-year trend shows a sector that contracted in 2023–24 under commodity and labour cost pressures, then rebounded — suggesting improving balance sheet discipline and better cost management across the top half of the ranking table.
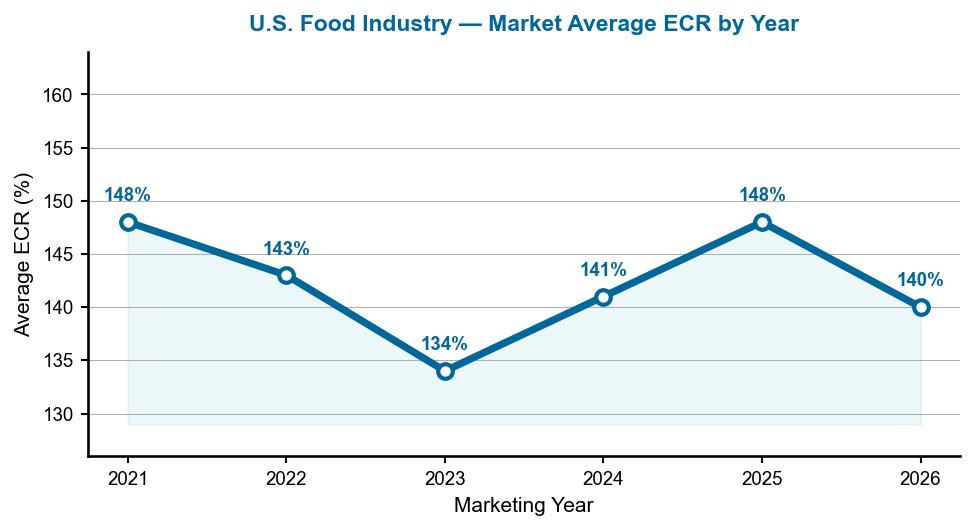
Figure 11 — Average ECR for the US food industry, marketing years 2021–2026.
This line chart traces the market average ECR from 2021 to 2026. The dip to 134% in 2024 coincided with sustained input-cost pressure — commodities, energy, and labour all squeezed margins, compressing capital ratios. The rebound to 148% in 2025 reflects stabilising input costs and improving pricing power. The slight pullback to 140% in 2026 may reflect new entrants or expanded coverage — with 21 companies in the current ranking, the full-sector average includes some weaker performers that anchor the mean below the top-company level.
Notable Movers
Lifeway Foods is the headline climber: from rank four in 2024 to rank one in 2026, driven by improving revenue performance relative to a consistently lean asset base. Freshpet Inc., the refrigerated pet-food specialist, appeared at rank four (ECR 184%) after oscillating between positions 4 and 26 in earlier years — a sign that its growth investments are starting to translate into capital strength. At the other end, Medifast Inc. dropped from the top spot in 2023 (ECR 227%) to fifth in 2026 (172%), as rising competition in the weight-management nutrition segment weighed on margins. J J Snack Foods’ one-place slip from first to second represents a healthy rotation at the top rather than any structural weakening.
Manager’s Takeaway
The 2026 US food industry rankings deliver a clear message: size is not destiny. Lifeway Foods, a $212 million kefir specialist, outranks giants ten times its size by virtue of a clean balance sheet and strong revenue performance relative to its asset base. J J Snack Foods demonstrates that a diversified snack conglomerate can sustain capital strength across economic cycles through conservative leverage and brand discipline. And Tyson Foods proves that even the mightiest meat processor can maintain a firmly above-average ECR through smart liability management. For investors and analysts, the RealRate ECR offers a powerful signal: the companies that control costs, manage debt intelligently, and grow revenues faster than their asset base consistently sit at the top of the table — year after year.