The U.S. Computers sector spans hardware giants, cloud networking leaders, and cybersecurity innovators — yet across all of them, the same financial variables separate the resilient from the vulnerable. This week’s RealRate infographic breaks down the industry’s capital structure across three analytical views, revealing what truly drives ECR in U.S. Computers industry and where the market’s valuation diverges from fundamentals.
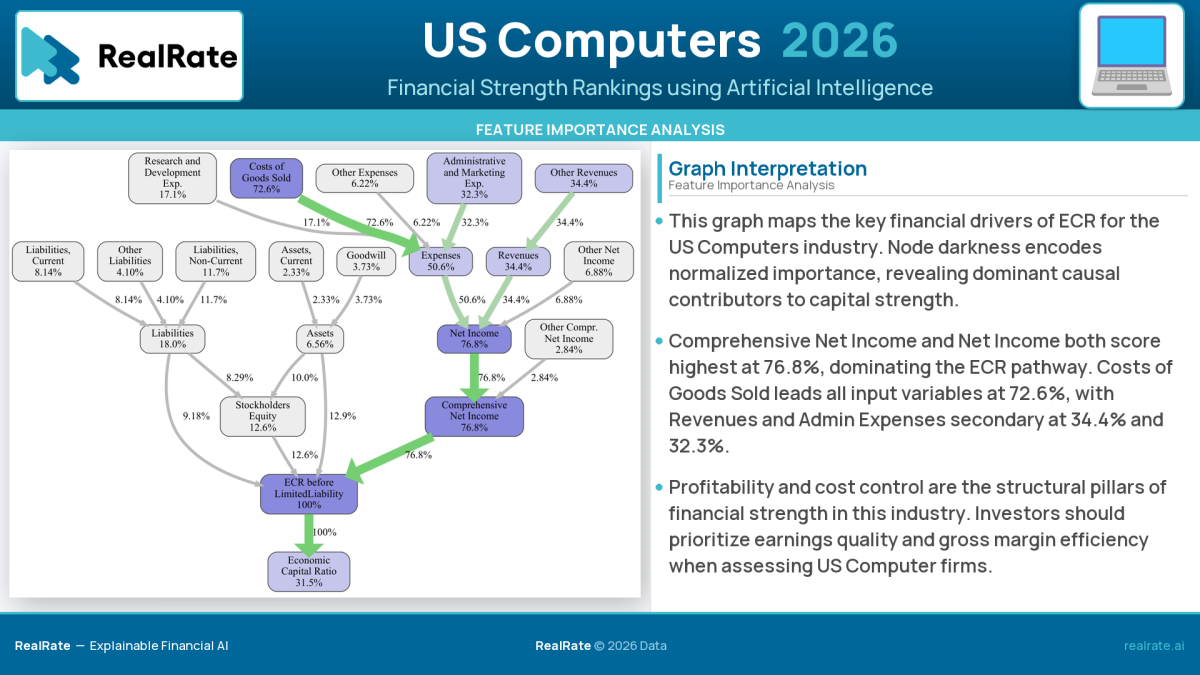
📊 Feature Importance — Maps the causal tree of ECR drivers; node darkness (0–100) shows which balance sheet and P&L variables most define financial strength across U.S. computer companies.
↳ Administrative & Marketing Expenses and Costs of Goods Sold dominate the causal structure — cost discipline is the single biggest determinant of ECR rank in this sector.
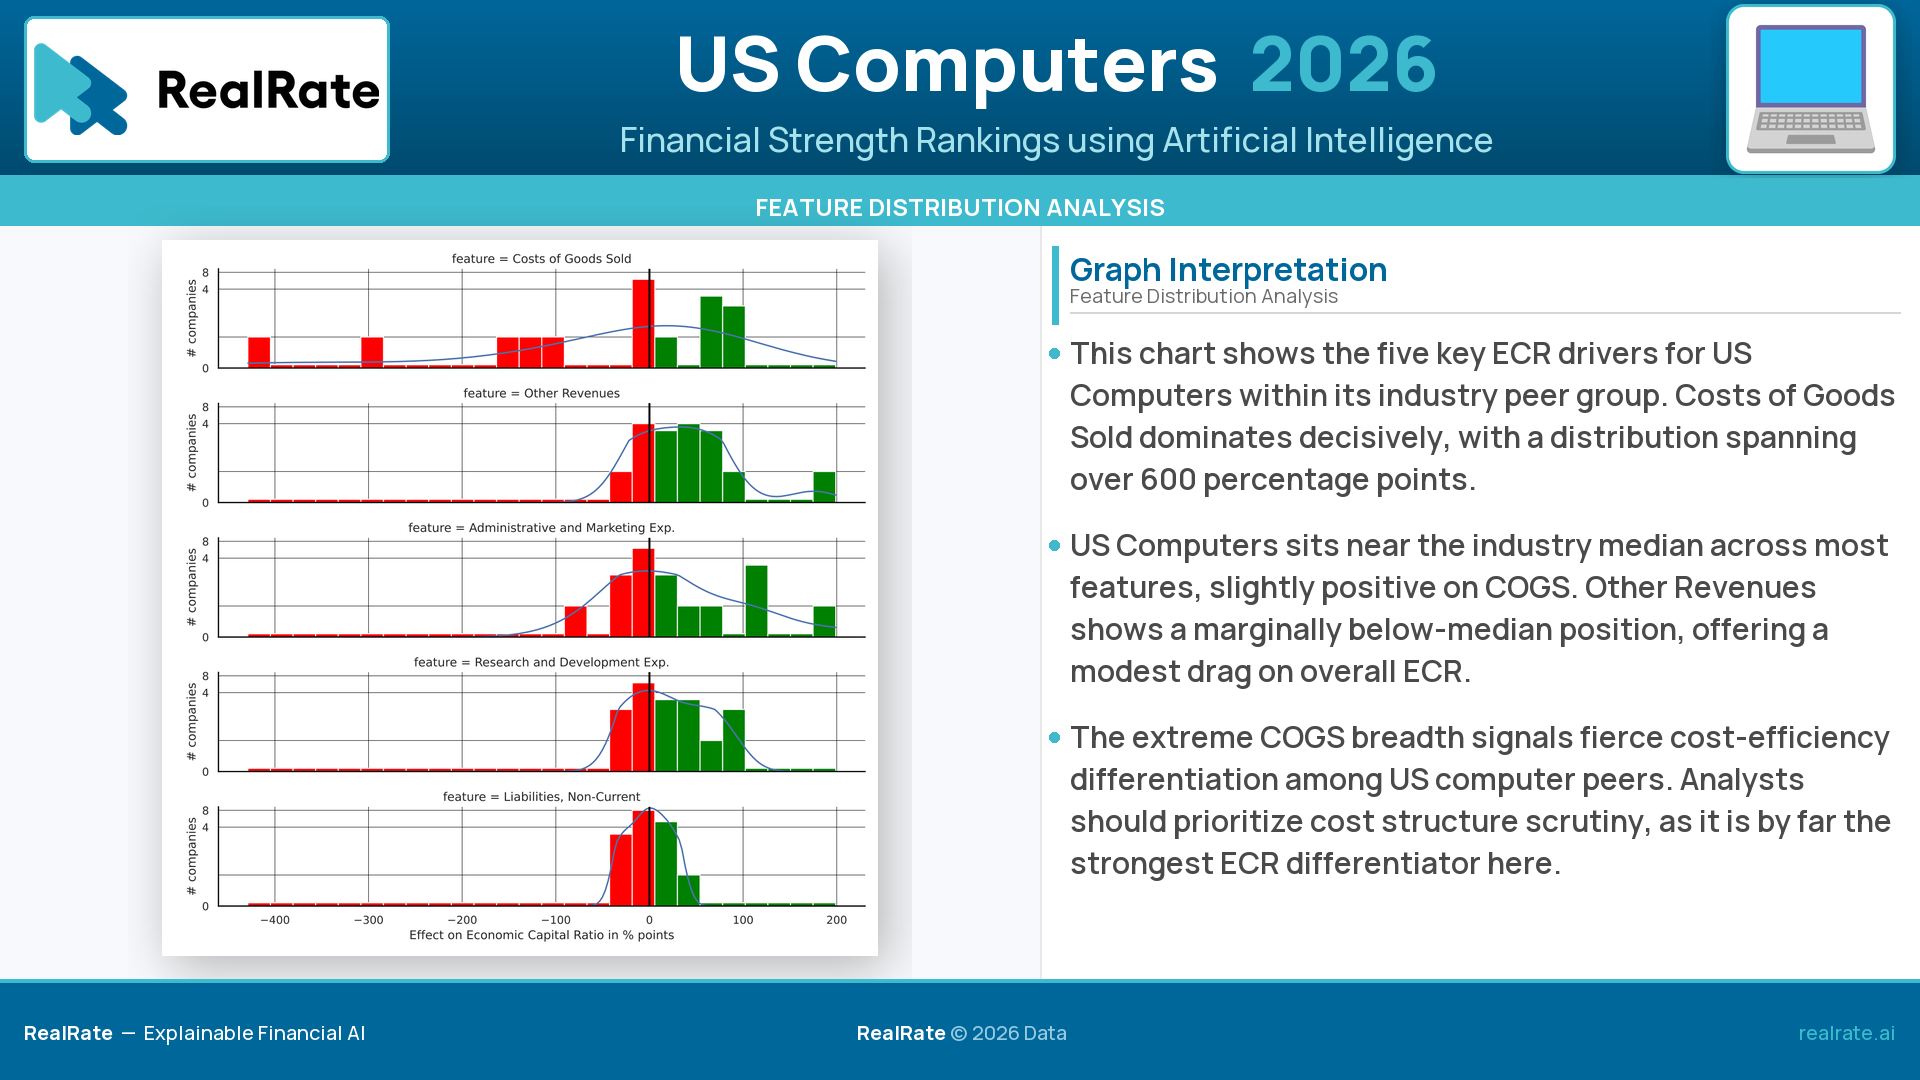
📈 Feature Distribution — Shows how the top-five ECR drivers spread across all companies via stacked histograms; wider distributions signal greater competitive differentiation, green bars = positive ECR effect, red bars = negative.
↳ Expense variables show the widest dispersion, confirming that companies diverge most on cost efficiency; Costs of Goods Sold produces extreme negative outliers near −400 points for the weakest performers.
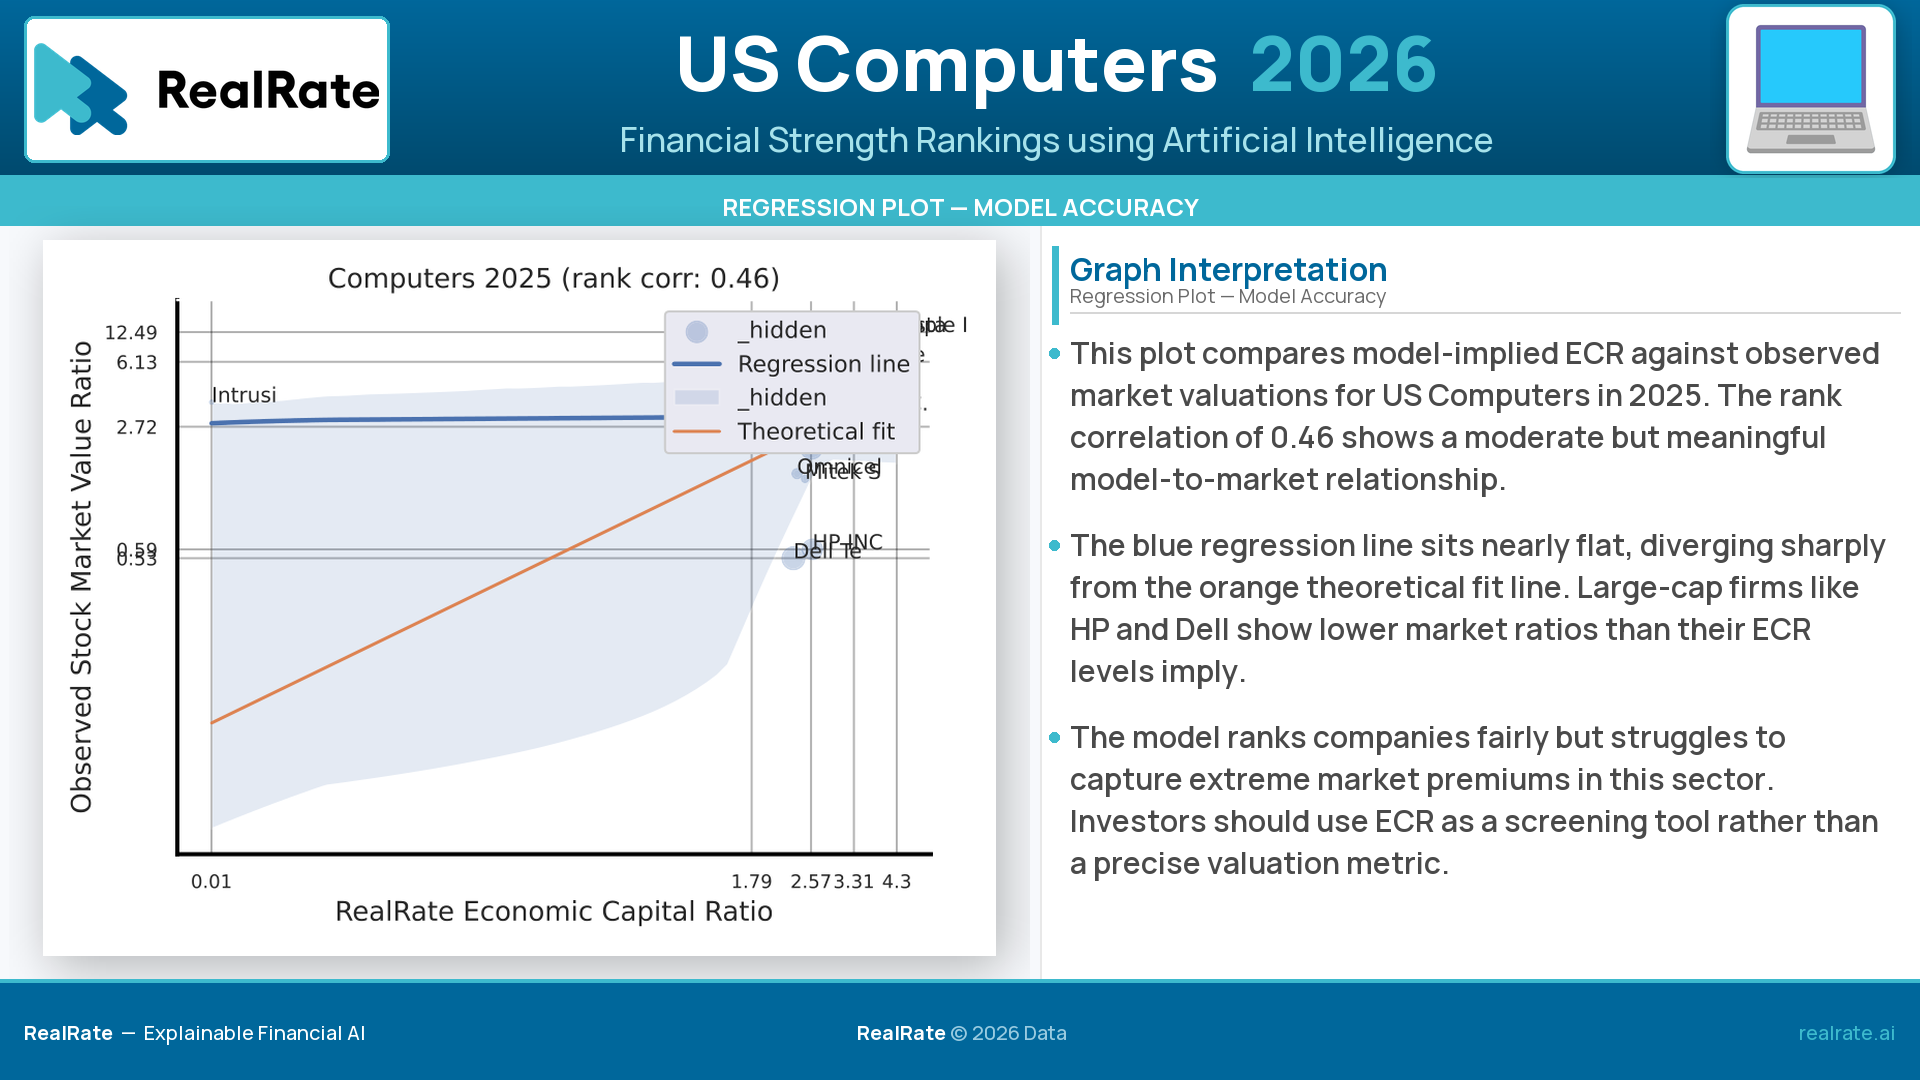
🔍 Regression Plot — Tests model accuracy by comparing model-implied ECR valuations against actual market-based valuations; the orange 45° identity line marks perfect alignment, the blue regression line shows the empirical fit.
↳ Most companies track close to the identity line, but high-ECR outliers command market premiums well above their model-implied values — reflecting growth expectations the ECR alone cannot capture.
In U.S. computer industry, financial structure is the foundation. Knowing which variables drive capital resilience is the edge that separates informed investors from the rest.
RealRate — Explainable financial AI
🔗 Full Rankings & Graphs: https://lnkd.in/gvsGkmbs