U.S. Hotels & Motels Rankings 2026: The Casino Operator That Outranked the World’s Biggest Hotel Company
From Casino Floors to a Pismo Beach RV Park — RealRate’s 2026 U.S. Hotels & Motels Rankings.
Introduction
The U.S. hotels and motels industry spans Las Vegas casino resorts, global hotel brands, and small regional operators. Across the 20 companies in RealRate’s 2026 ranking, combined revenues reached $129 billion against $238 billion in total assets — figures that reflect the sector’s scale and its uneven post-pandemic recovery.
RealRate’s 2026 rankings use the Economic Capital Ratio (ECR) to measure true financial resilience. Based on audited balance sheet data for fiscal year 2025, the ECR divides a company’s economic value by its total assets — enabling fair comparisons across vastly different company sizes, from multinational hotel groups to single-property operators. The 2026 market average ECR for U.S. hotels and motels is 83%, down sharply from a recent high of 103% in 2024 — a sector still working through the after-effects of high interest rates and uneven travel demand.
2026 Rankings at a Glance
BOYD Gaming Corp claimed the top spot with an extraordinary ECR of 355% — 271 percentage points above the market average and more than double the score of any other company in the ranking. Marriott International, the world’s largest hotel company, came in second at 169%. Pismo Coast Village, a tiny California RV-resort operator making its ranking debut, completed the top three at 149%. All three comfortably clear the 83% benchmark, and the figures were cross-checked across two independent data tables, which agree on every value.
Figure 1 — U.S. Hotels & Motels Industry 2026: Top 5 companies by ECR. Dashed line = 83% market average. Source: RealRate Archive (JSON, 2025).
Reading this chart: the horizontal bars show each company’s ECR — longer bars mean greater financial strength relative to assets. The dashed line marks the 83% market benchmark; every member of the top five clears it comfortably. What stands out is the 186-percentage-point gap between BOYD Gaming (355%) and second-placed Marriott (169%) — a far wider margin than typically separates a #1 and #2 finisher, and a sign of just how unusual BOYD’s 2026 result is.
A Multi-Year Story
BOYD Gaming has held a top-two position in five of the last six marketing years, but 2026 marks a dramatic break from its own pattern: its ECR leapt from 212% to 355%, by far its strongest result on record. Marriott International has followed a steadier climb — from sixth place and an ECR of 114% in 2021 to second place and 169% today — evidence of a slow but consistent improvement in balance sheet strength as the hotel giant’s post-pandemic recovery matured. Pismo Coast Village, by contrast, is a newcomer to this particular podium: it ranked first as recently as 2022 with an ECR of 201%, dropped out of the rankings in 2025, and has now re-entered at third place — the ranking’s best comeback story.
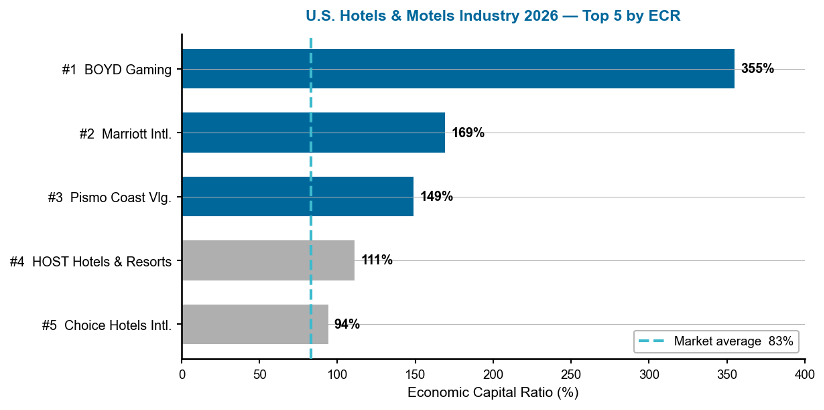
Figure 2 — ECR evolution of the top-3 companies, marketing years 2021–2026. Gaps indicate years where data were not available for that company. Source: RealRate Archive.
Reading this chart: each line traces a company’s ECR across marketing years — rising lines signal improving capital strength, and the dashed grey line is the market average. BOYD Gaming’s near-vertical jump in the final year is the chart’s most dramatic feature, lifting it far clear of both its own history and its competitors. Marriott’s line shows a gentler, more typical upward drift, while Pismo Coast Village’s gap in 2025 — visible as a break in its line — illustrates how smaller companies can drop in and out of a ranking as filing timing and asset bases shift.
Company Profiles
1. BOYD Gaming Corp — The Casino Operator on Top of the Hotel World
BOYD Gaming is a Las Vegas-based casino and gaming company operating dozens of properties across the Las Vegas Strip, downtown Las Vegas, and regional markets in roughly ten U.S. states, alongside an online gaming business. In fiscal 2025 it reported revenues of $4.09 billion against expenses of $3.83 billion, generating net income of $1.84 billion. Total assets of $6.57 billion are matched against just $979 million in liabilities, leaving equity of $5.6 billion — an unusually clean balance sheet for a capital-intensive operator of large physical properties.
BOYD’s greatest ECR driver is its bottom line: net income alone lifts the ratio 216 percentage points above the industry average, with low relative liabilities adding a further 199 points. Other expenses are the main drag, cutting the ECR by 144 points — the cost of running a sprawling network of casino-resorts. The net result is an ECR of 355%, a full 271 points above the market average and the standout result of this year’s entire ranking.
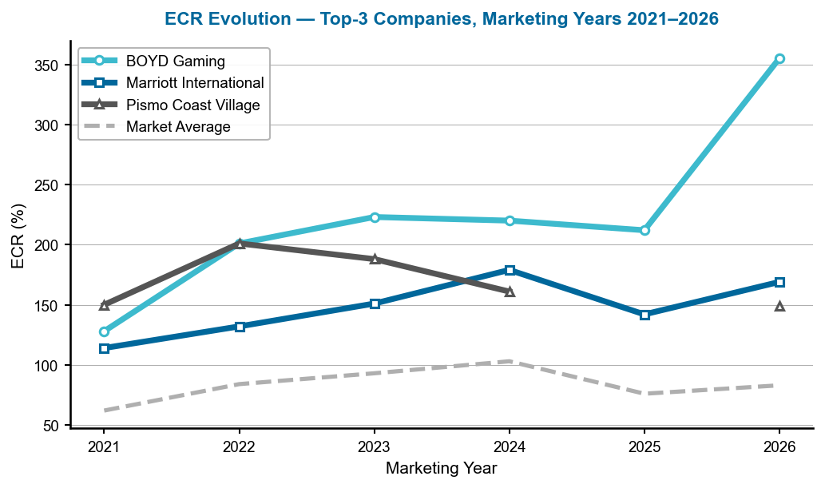
Figure 3 — BOYD Gaming: causal ECR graph. Each node shows the effect (in ECR percentage points) of that variable relative to the industry average. Green paths boost ECR; red paths reduce it. Source: RealRate Archive.
This causal graph is the most revealing graphic for any company. Working from the bottom up, the chain into ‘Economic Capital Ratio’ runs through ‘Net Income’ (+216) and ‘Liabilities’ (+199), both far above the industry norm — together they explain most of BOYD’s exceptional score. ‘Other Expenses’ (−144) is the clearest drag, the one meaningful counterweight to an otherwise dominant profile. The story the graph tells is simple: BOYD earns enormously relative to its asset base while keeping its balance sheet remarkably debt-light — a rare combination for a property-heavy casino operator.
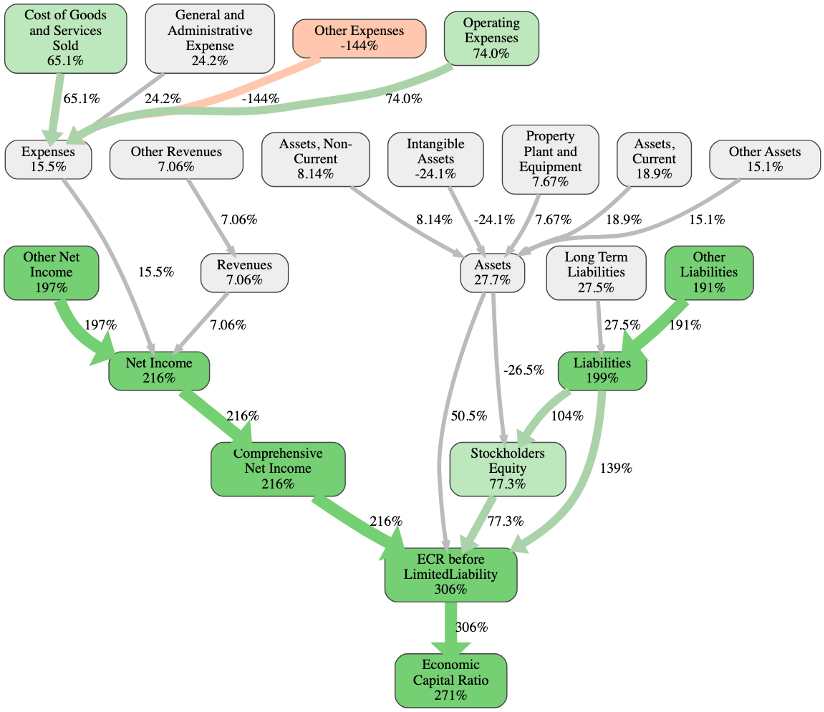
Figure 4 — BOYD Gaming: ECR drivers versus industry average. Each bar shows a variable’s effect on ECR in percentage points; green = positive, red = negative. Source: RealRate Archive.
This bar chart quantifies each variable’s pull on BOYD’s ECR. Net Income (+216 pp) and Liabilities (+199 pp) are by far the largest positive forces, with Other Liabilities (+191 pp) reinforcing the same theme: BOYD converts its casino-resort operations into outsized profit while carrying very little relative debt. Stockholders’ Equity (+77 pp) confirms the strength of its capital cushion. Other Expenses (−144 pp) is the only material drag — the unavoidable cost of running large entertainment properties — but it is dwarfed by the positive drivers, leaving BOYD 271 points clear of the market average.
2. Marriott International — The Global Giant Climbs Steadily
Marriott International is the world’s largest hotel company, operating roughly 30 brands — including The Ritz-Carlton, Sheraton, Westin, and JW Marriott — across some 9,000 properties in over 140 countries on a largely asset-light franchise and management model. In fiscal 2025 it reported revenues of $26.2 billion and net income of $2.6 billion. Total assets of $27.5 billion are set against $8.4 billion in liabilities, leaving equity of $19.1 billion — a scale few rivals can match.
Marriott’s greatest ECR driver is its revenue performance: other revenues push the ratio 104 percentage points above the industry average, with lean relative liabilities adding a further 94 points. The clear weak point is expenses, which pull the ECR down by a steep 334 points — the cost base that comes with running a hospitality empire at global scale. The net result is an ECR of 169%, placing Marriott 86 points above the market average and confirming that even the industry’s biggest name can post a firmly above-average score.
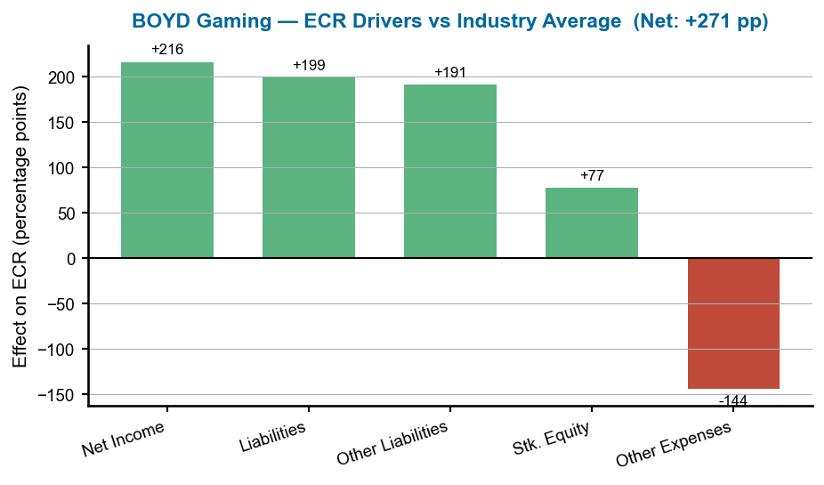
Figure 5 — Marriott International: individual backtesting correlation — RealRate ECR vs. observed market value ratio (red dot marks Marriott’s position). Source: RealRate Archive.
This company-specific scatter plot — identified by the red dot — shows how closely RealRate’s ECR model tracks Marriott’s actual market valuation against the rest of the industry. Marriott’s dot sits near the top of the cluster, close to the regression line, indicating that the market values the company roughly in line with what its ECR would predict — neither a notable bargain nor an inflated premium. The broader upward slope across the plotted hotel companies confirms that ECR is a meaningful signal of market value in this sector, and that Marriott’s valuation reflects its underlying fundamentals rather than hype.
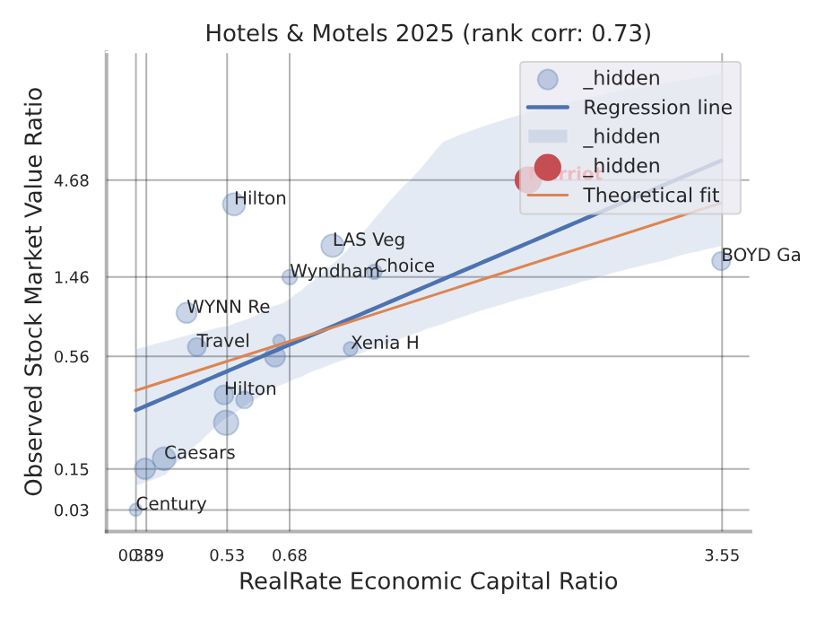
Figure 6 — Marriott International: ECR drivers versus industry average. Each bar shows a variable’s effect on ECR in percentage points; green = positive, red = negative. Source: RealRate Archive.
The effects chart for Marriott tells a twin-pillar story: Other Revenues (+104 pp) and Other Liabilities (+98 pp) — reinforced by Liabilities (+94 pp) — together account for the bulk of its ECR advantage, reflecting global scale and a conservative debt profile for a company of its size. Stockholders’ Equity (+34 pp) adds a smaller but steady contribution. Other Expenses (−334 pp) is by far the largest drag in this entire report — the structural cost of operating a worldwide hospitality network — yet Marriott’s other strengths are large enough to absorb it and still leave the company 86 points above the market average.
3. Pismo Coast Village — The Smallest Company, the Biggest Surprise
Pismo Coast Village is about as far from a global hotel chain as a hospitality company can get: it owns and operates a single RV resort and campground in Pismo Beach, California, with an unusual ownership structure in which many shareholders are also long-term users of the property. In fiscal 2025 it reported modest revenues of $10.1 million against expenses of $9.6 million, for net income of roughly $0.9 million. Total assets of $30.5 million are set against just $4.5 million in liabilities, leaving equity of $26.0 million — a tiny but exceptionally lean balance sheet.
Pismo’s greatest ECR driver is its expense structure: other expenses lift the ratio 89 percentage points above the industry average, with stockholders’ equity contributing a further 70 points — both reflecting a business with almost no debt relative to its size. Operating expenses are the clear weak spot, cutting the ECR by 182 points. The net result is an ECR of 149%, placing this single-property operator 65 points above the market average and three places above companies many hundreds of times its size.
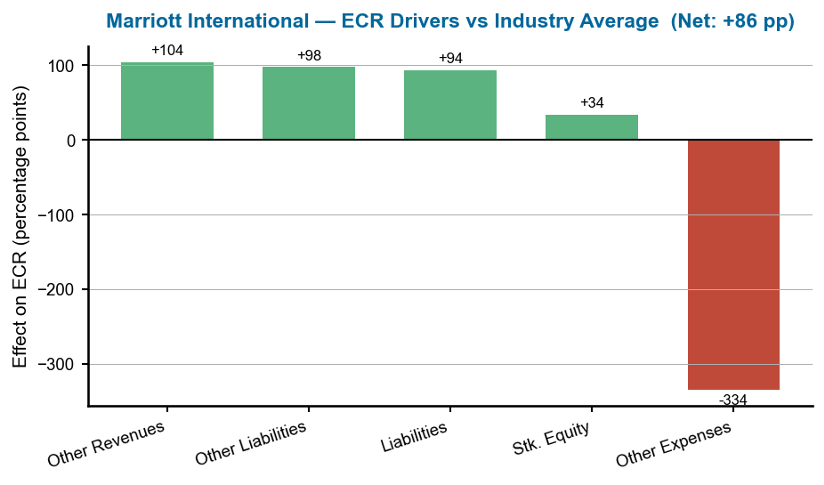
Figure 7 — Pismo Coast Village: company feature-distribution plot. Black arrows mark where Pismo sits, within the full industry distribution, on its two biggest strengths and two biggest weaknesses. Source: RealRate Archive.
This chart places Pismo Coast Village inside the spread of all 20 ranked companies for its four most influential variables. The arrows show that Pismo sits toward the favourable (green) end of the distribution for its major strength, Other Expenses, and its minor strength, Other Liabilities — in both cases clearly to the right of the industry’s red-zone cluster. For its weaknesses, Liabilities, Current sits almost exactly at the industry’s central peak (a near-neutral effect), while Operating Expenses falls toward the unfavourable tail. The overall picture is of a company whose lean liability structure outweighs a single, identifiable cost drag.
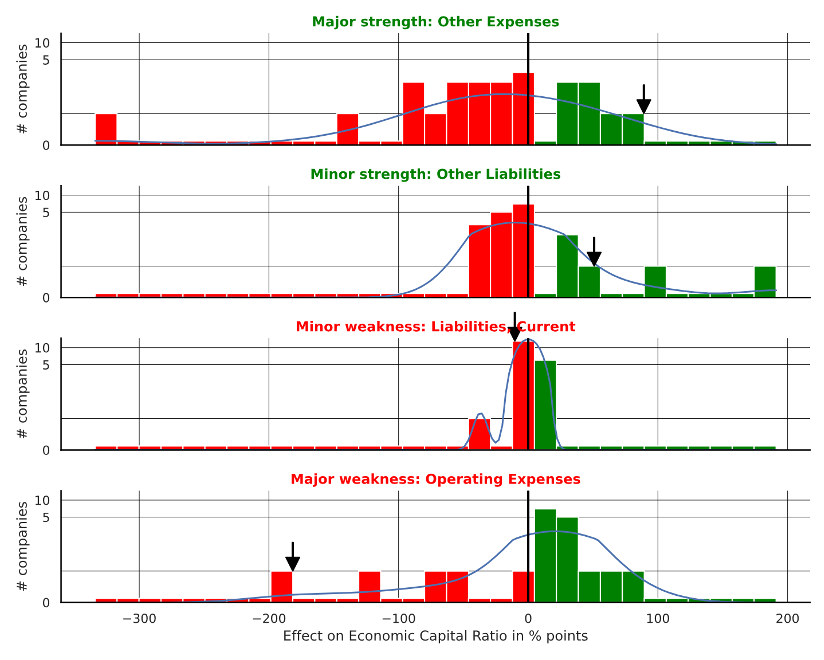
Figure 8 — Pismo Coast Village: ECR drivers versus industry average. Each bar shows a variable’s effect on ECR in percentage points; green = positive, red = negative. Source: RealRate Archive.
At Pismo’s tiny scale, the effects chart shows a business built almost entirely on balance-sheet discipline rather than profit volume: Other Expenses (+89 pp), Stockholders’ Equity (+70 pp) and Other Liabilities (+51 pp) together carry the company’s score, all stemming from its near-absence of debt. Net Income (+15 pp) makes only a modest contribution — a reminder of just how small this operator is next to names like Marriott. Operating Expenses (−182 pp) is the one clear weak point, but it is not enough to prevent Pismo from landing 65 points above the market average and inside the industry’s top three.
What Drives Financial Strength in Hotels?
RealRate’s model traces ECR back through a chain of financial-statement variables, and for the U.S. hotels and motels sector four stand out as the most influential primary drivers: Other Expenses, Other Liabilities, Other Revenues, and Property, Plant & Equipment. In plain terms, how a hotel or casino company manages its cost base, its non-core liabilities, and its physical-property footprint matters more to its financial strength than the sheer size of its revenue line — a pattern that helps explain why a single-property operator like Pismo Coast Village can out-rank household names many times its size.
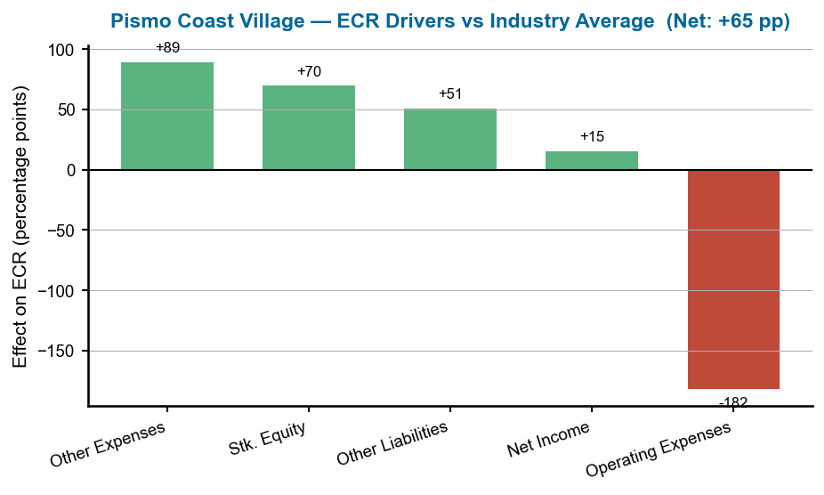
Figure 9 — U.S. Hotels & Motels Industry: feature-importance graph (industry-level). Percentages on each arrow show how strongly that variable’s importance carries through to the next stage of the model, ultimately feeding into the Economic Capital Ratio. Source: RealRate Archive.
Unlike a simple bar chart, this is a flow diagram: individual financial-statement line items at the top funnel down through aggregated variables (Expenses, Revenues, Liabilities, Assets) into the final Economic Capital Ratio at the bottom, with each arrow’s percentage showing that variable’s relative weight in the model. The four highlighted boxes — Other Expenses (100%), Other Liabilities (51%), Property, Plant & Equipment (26%), and Other Revenues (23%) — carry the heaviest influence on the model’s predictions. Notably, the chain from Expenses down to ECR (19% → 34% → 33% → 35% → 35%) is wider and more direct than the chain from Assets, underscoring that cost discipline, not asset size, is what most separates strong hotel-industry balance sheets from weak ones.
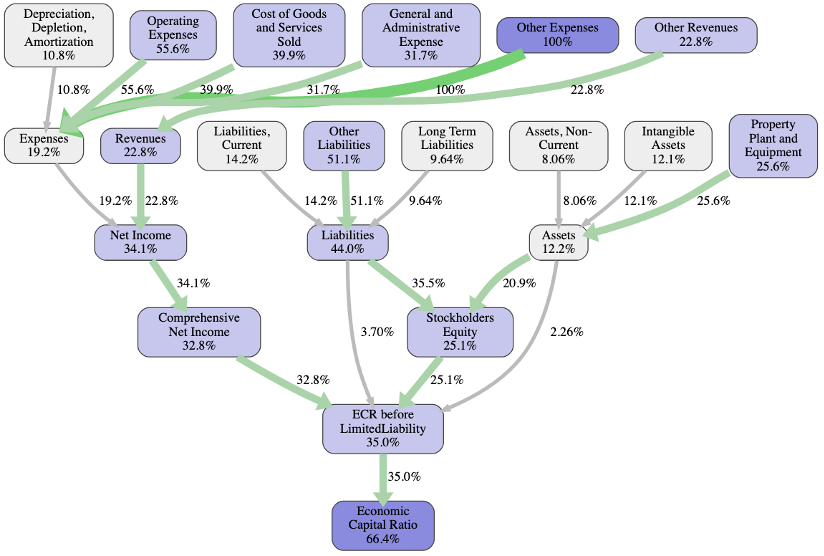
Figure 10 — U.S. Hotels & Motels Industry: feature-distribution plot (industry-level, no company arrow). Each panel shows how one variable’s effect on ECR is spread across all ranked companies. Source: RealRate Archive.
This industry-wide chart (no black arrow, since it covers the whole sector rather than one company) shows how five key variables’ effects on ECR are distributed across the 20 ranked companies. Other Expenses and Other Liabilities each show a roughly even split between companies that are helped and hurt by them, while Operating Expenses and Cost of Goods and Services Sold skew more heavily toward the positive (green) side — meaning most hotel companies in this ranking are not penalised heavily for these costs. The spread illustrates just how differently individual companies are affected by the same line items, depending on their business model and scale.
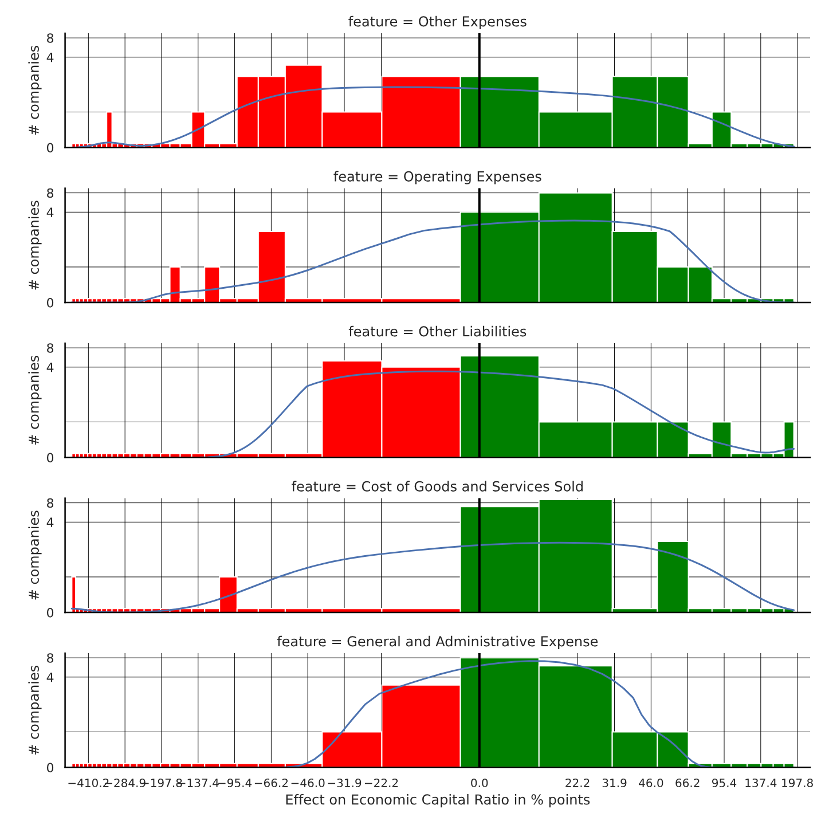
Figure 11 — U.S. Hotels & Motels Industry: backtesting correlation — RealRate ECR vs. observed market value ratio (industry-level, no red company dot). Source: RealRate Archive.
This scatter plot is an industry-level correlation chart (no red dot, as that would mark a specific company). The X-axis shows each company’s RealRate-calculated ECR; the Y-axis shows its observed market-value ratio. The upward-sloping regression line — with a rank correlation of 0.73 — confirms a clear positive relationship: companies with stronger ECR scores do tend to command higher market valuations. BOYD Gaming sits furthest to the right, valued broadly in line with what its exceptional ECR would predict, while names like Hilton trade somewhat above the line — suggesting the market is pricing in growth expectations beyond what current balance-sheet strength alone would justify.
Market Statistics
The average ECR across the 20 U.S. hotel and motel companies in 2026 is 83% — down from 103% in 2024 and well below the 93% level of 2023, though still above the 62% trough recorded in 2021. The wide span between the top performer (355%) and the weakest company (a fraction of one percent) underlines how unevenly the post-pandemic recovery has played out across the sector — from cash-rich casino operators and niche resort owners to heavily leveraged regional chains still rebuilding their balance sheets.
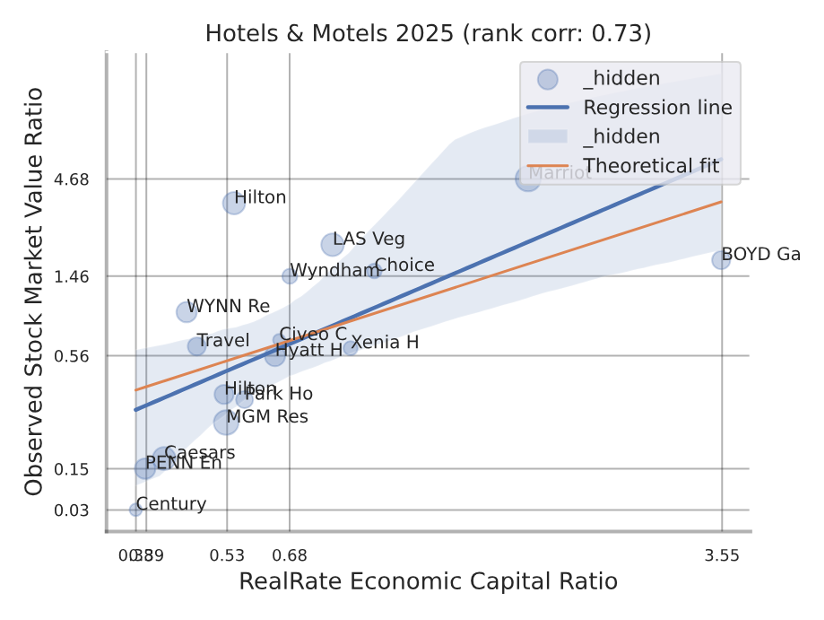
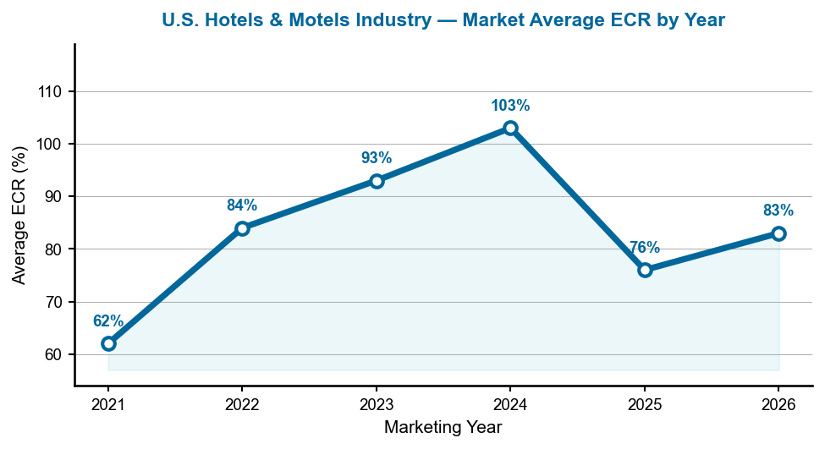
Figure 12 — Average ECR for the U.S. hotels & motels industry, marketing years 2021–2026.
This line chart traces the market average ECR from 2021 to 2026. The climb from 62% in 2021 to a peak of 103% in 2024 reflects the industry’s recovery from pandemic-era lows, as travel demand rebounded and balance sheets repaired. The subsequent pullback to 76% in 2025 and modest rebound to 83% in 2026 suggest the recovery has plateaued — likely a combination of higher financing costs, a smaller pool of ranked companies, and renewed caution in capital spending across the sector.
Notable Movers
BOYD Gaming is the headline story of 2026: its ECR more than doubled year-on-year, vaulting an already top-ranked company to a new high and the largest gap between first and second place in recent memory. Civeo Corp climbed 11 positions, from 20th to 9th, on the back of standout revenue performance — one of the sharpest single-year jumps in the ranking’s history. At the other end, Hyatt Hotels Corp slipped five places, from 5th to 10th, dragged down by weak property, plant and equipment figures. And Pismo Coast Village’s arrival at third place — after going unranked in 2025 — makes it officially this year’s best newcomer, a reminder that size is no guarantee of a place at the top.
Manager’s Takeaway
The 2026 U.S. hotels and motels rankings deliver a striking message: balance-sheet discipline beats brand size. BOYD Gaming, a regional casino operator, posted a financial-strength score more than twice that of Marriott — the world’s largest hotel company by far. Marriott itself shows that scale and an above-average ECR are not mutually exclusive, as long as revenue performance and lean liabilities offset a heavy cost base. And Pismo Coast Village, a single-property operator a fraction the size of its rivals, proves that a debt-light balance sheet can carry a small company into the same league as global names. For investors and operators alike, the RealRate ECR points to a consistent truth: the companies that control costs and keep liabilities lean — not necessarily the biggest ones — sit at the top of the table, year after year.