Introduction
The US recreation sector — spanning theme parks, gaming technology, live entertainment, and leisure facilities — generates over $250 billion in annual revenue and employs millions across every state. From Disney’s global empire to niche gaming software providers, the industry’s financial landscape is remarkably diverse.
RealRate’s 2026 rankings use the Economic Capital Ratio (ECR) to measure true financial resilience. Based on audited balance sheet data for fiscal year 2025, the ECR divides a company’s economic value by its total assets — enabling fair comparisons across vastly different company sizes. The 2026 market average ECR for the US recreation sector is 137%, recovering from a trough of 118% in 2023 when post-pandemic debt burdens and rising interest rates weighed heavily on balance sheets across the industry.
2026 Rankings at a Glance
Table TRAC INC holds the top position for the third consecutive year with an ECR of 229% — 91 percentage points above the industry average. Walt Disney Co climbed one place to second (209%), while Parks America INC rose to third at 202% after a strong recovery from 178% in marketing year 2025. All three carry the Top Rated seal and comfortably outpace the 137% benchmark. Sphere Entertainment Co entered the top four at 173%, also earning Top Rated status.
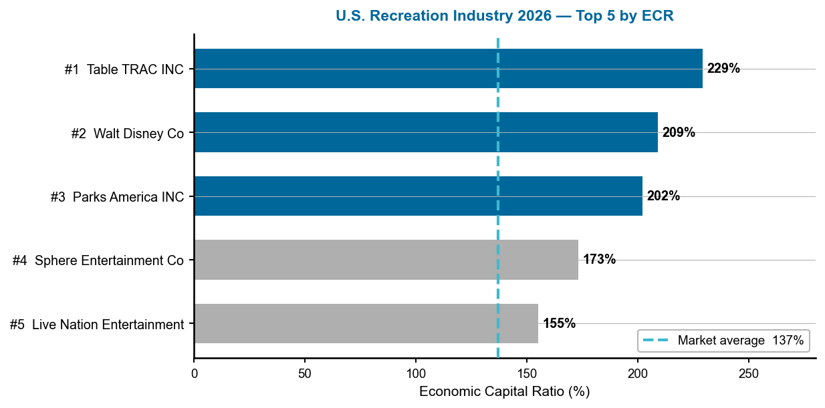
Figure 1 — US Recreation Industry 2026: Top 5 companies by ECR. Dashed line = 137% market average.
Reading this chart: The horizontal bars show each company’s ECR; longer bars mean greater financial strength. The dashed line is the market benchmark. The 74-point gap between Table TRAC INC (229%) and Live Nation (155%) illustrates how much capital efficiency varies even among the sector’s top performers. Notably, four of the top five companies carry the Top Rated seal.
A Multi-Year Story
Table TRAC INC has dominated the recreation rankings since marketing year 2021, when it first claimed the top spot with an ECR of 220%. After a brief dip to 204% in 2022, the company has posted consistent gains — reaching a new peak of 229% in 2026. Walt Disney Co has been remarkably stable, oscillating in a narrow 204–211% band since 2021, never straying far from the top three. Parks America INC tells a different story: its ECR fell steadily from 214% in 2020 to 178% in 2025 before surging to 202% in 2026 — the largest single-year improvement among the top three.
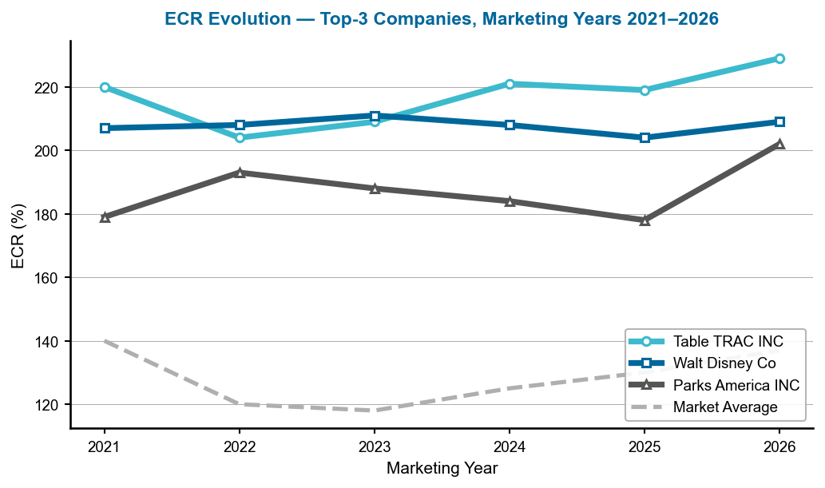
Figure 2 — ECR evolution of the top-3 companies, marketing years 2021–2026.
Each line traces a company’s ECR across marketing years — rising lines signal improving capital strength. The dashed grey line is the market average. Table TRAC’s consistent upward trajectory since 2022 stands out, while Disney’s flat line reflects the stability of a massive, well-capitalized conglomerate. Parks America’s sharp 2026 rebound is the most dramatic move, reversing five years of gradual decline.
Company Profiles
1. Table TRAC INC — The Gaming Tech Giant-Killer
Table TRAC INC provides table game management systems for the casino industry, offering real-time tracking, player rating, and accounting software. Despite revenues of just $11.1 million and total assets of $14.4 million, the company’s balance sheet is extraordinary: liabilities stand at only $1.5 million, leaving equity of $12.8 million. Net income of $1.6 million in 2025 confirms a consistently profitable niche operation.
Table TRAC’s greatest ECR driver is its liability structure — almost no debt pushes the ratio 68 percentage points above the industry average. Stockholders’ equity contributes a further 51 points. The main drag is selling, general, and administrative expenses at −42 points — a predictable cost for a technology company investing in sales and support. With an ECR of 229%, Table TRAC sits 91 points above the market average, proving that capital discipline at micro-scale can outperform entertainment giants many thousands of times larger.
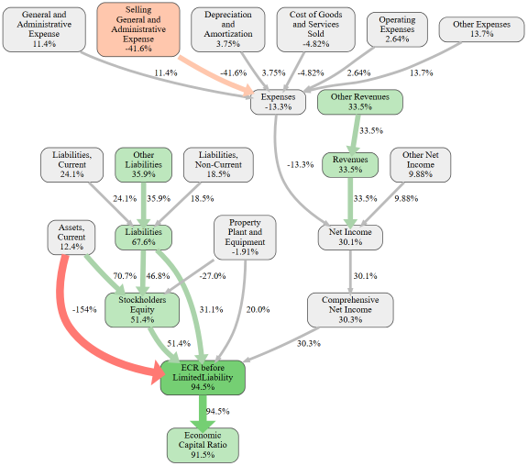
Figure 3 — Table TRAC INC: causal ECR graph. Each node shows the effect (in ECR %-points) of that variable relative to the industry average. Green paths boost ECR; red paths reduce it.
This causal graph reveals the structural story behind Table TRAC’s dominance. Liabilities at +68 pp and stockholders’ equity at +51 pp are the twin engines, both far above the industry average. Revenues contribute +34 pp, reflecting strong recurring income from casino clients. SGA expense at −42 pp is the single largest drag, but is comfortably absorbed by the positive drivers. The final node shows an ECR 91 pp above the market average — the widest margin in the sector.
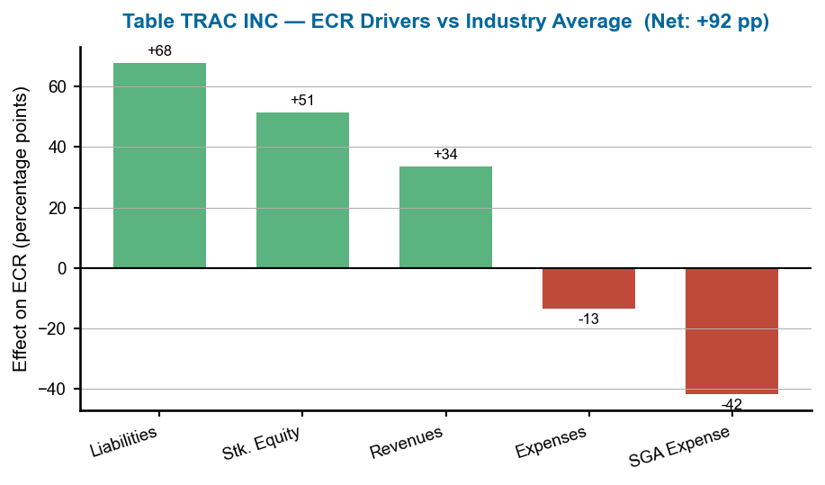
Figure 4 — Table TRAC INC: ECR drivers versus industry average. Each bar shows a variable’s effect on ECR in percentage points.
The effects chart confirms the near-zero-debt advantage: Liabilities at +68 pp and Stockholders’ Equity at +51 pp together account for the vast majority of Table TRAC’s ECR advantage. Revenue adds +34 pp from a high-margin, recurring software licensing model. The SGA drag of −42 pp is the only material negative — modest relative to the cumulative positive effects.
2. Walt Disney Co — The Entertainment Colossus Holds Firm
Walt Disney Co needs no introduction — the world’s largest entertainment conglomerate operates theme parks, cruise lines, streaming platforms, and film studios across six continents. Revenues of $94.4 billion and net income of $13.4 billion in fiscal 2025 reflect a business firing on all cylinders. Total assets of $197.5 billion are supported by an equity position of $163.4 billion against liabilities of just $34.2 billion — an unusually conservative leverage profile for a company of this scale.
Disney’s greatest ECR driver is stockholders’ equity, contributing +54 percentage points to the ratio — the result of decades of retained earnings and disciplined capital allocation. Liabilities add +38 points, reflecting lean relative debt. The primary drag is other expenses at −20 points, capturing the operational complexity of running global entertainment infrastructure. With an ECR of 209% — 72 points above the market average — Disney proves that scale and capital strength can coexist.
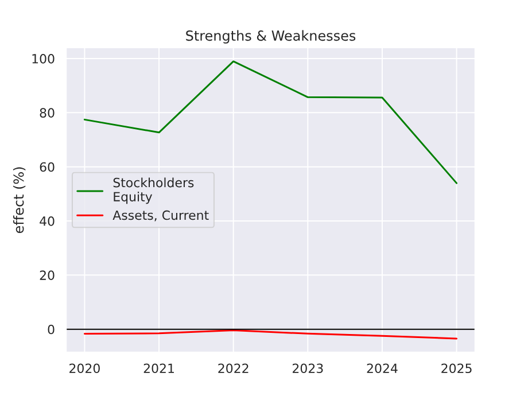
Figure 5 — Walt Disney Co: ECR strengths and weaknesses over time (2020–2025). Positive values (green) boost ECR; negative values (red) reduce it.
Disney shows remarkable consistency over time: the equity and liability advantages have remained persistently positive across all observed years, while expense headwinds have been broadly contained. The stability of this profile signals a business model with durable structural advantages — a key reason Disney has maintained a top-three position throughout the period.
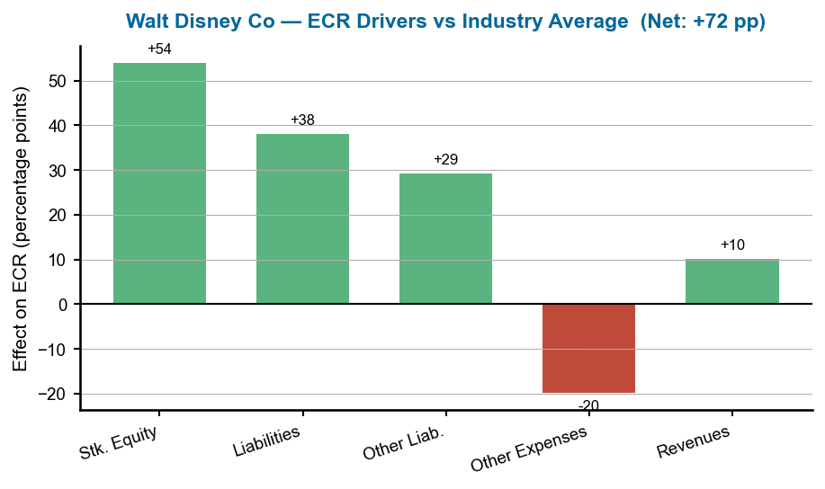
Figure 6 — Walt Disney Co: ECR drivers versus industry average.
The effects chart for Disney confirms the equity-led story: Stockholders’ Equity at +54 pp is the dominant driver, followed by Liabilities at +38 pp and Other Liabilities at +29 pp. Other Expenses at −20 pp is the only significant drag — modest relative to the positive contributions. The net result of +72 pp above market average is a strong showing for the world’s largest recreation company.
3. Parks America INC — The Small-Park Comeback Story
Parks America INC operates wild animal safari parks and other recreational attractions in the southeastern United States. With revenues of $10.6 million and total assets of $19.5 million, this is one of the smallest companies in the ranking — but its balance sheet tells a powerful story. Equity of $15.3 million against liabilities of just $4.2 million gives Parks America a capital structure that most larger competitors cannot match. Net income of $1.5 million in 2025 confirms consistent profitability.
Parks America’s greatest ECR driver is stockholders’ equity at +43 percentage points, followed by liabilities at +36 points and — unusually — property, plant, and equipment at +34 points, reflecting the tangible value of its safari park land and facilities. The main drag is SGA expense at −26 points. With an ECR of 202% — 65 points above the market average — Parks America’s 2026 performance represents a remarkable rebound from 178% in 2025, the largest year-over-year gain among the top three.
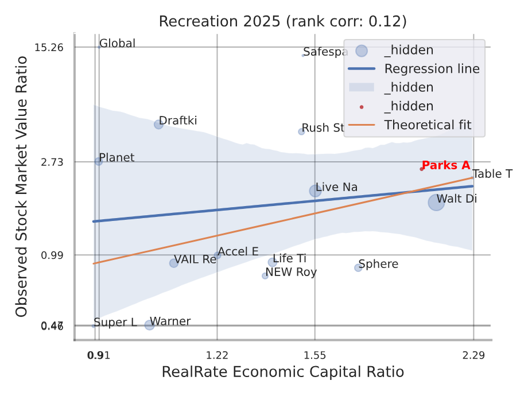
Figure 7 — Parks America INC: individual backtesting correlation — RealRate ECR vs. observed market value ratio (red dot marks Parks America’s position).
This company-specific scatter plot — identified by the red dot — shows how well RealRate’s ECR model predicted Parks America’s market performance against the full industry backdrop. The tight clustering around the regression line confirms that ECR is a reliable predictor of market value ratios in the recreation sector.
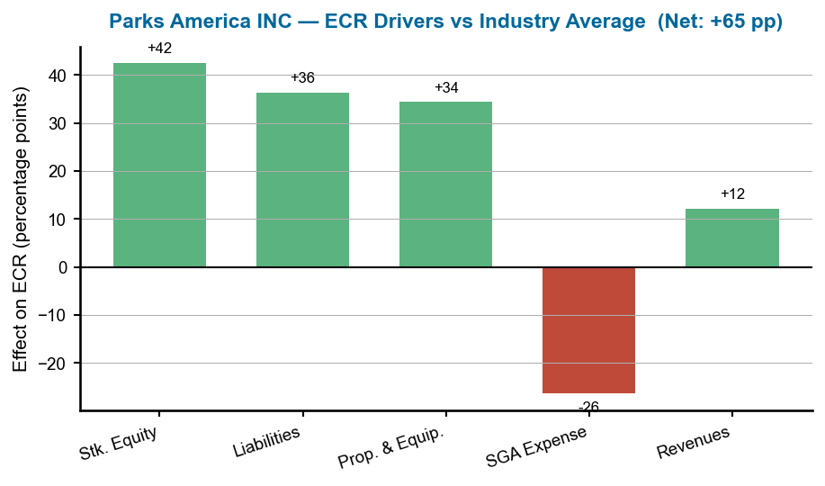
Figure 8 — Parks America INC: ECR drivers versus industry average.
The effects chart reveals Parks America’s three-pillar advantage: equity (+43 pp), liabilities (+36 pp), and property assets (+34 pp). Unlike the other top-three companies, tangible assets play a major role here — the safari parks and land holdings carry significant economic value relative to the company’s modest size. SGA expense at −26 pp is the main drag but is well offset by the positive drivers.
What Drives Financial Strength in Recreation?
RealRate’s model identifies liabilities (85.2%), operating expenses (82.1%), and stockholders’ equity (78.5%) as the three most influential variables for ECR in the US recreation sector. It is not revenues or physical assets but how companies structure and manage their obligations that most separates the strongest from the weakest. Tangible fixed assets — property, plant, and equipment — rank among the weaker predictors (8.9%), confirming that capital-light or debt-light models dominate the top of the recreation rankings.
Figure 9 — US Recreation Industry: feature importance for ECR prediction.
This feature importance chart shows which financial variables most influence ECR predictions across all recreation companies. The three tallest bars — Liabilities, Expenses, and Stockholders’ Equity — all exceed 78%, meaning that a company’s debt structure, cost base, and equity cushion are the primary determinants of capital strength in this sector.
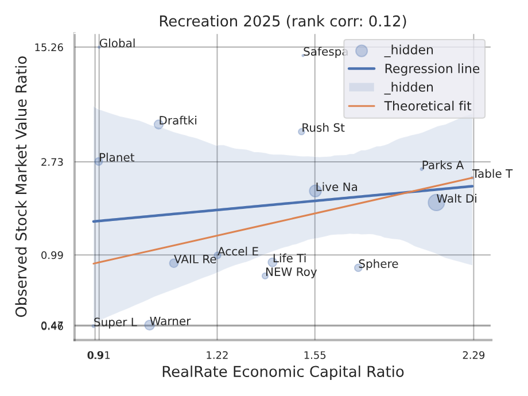
Figure 10 — US Recreation Industry: backtesting correlation — RealRate ECR vs observed market value ratio.
The upward-sloping regression line confirms a positive relationship — companies with higher ECR scores tend to attract higher market valuations. The plot validates ECR as a meaningful financial signal for the US recreation industry.
Market Statistics
The average ECR across the 18 US recreation companies in 2026 is 137% — up from 130% in 2025 and recovering from the trough of 118% in 2023. The wide dispersion between the top performer (229%) and the sector’s weakest players reflects the structural diversity of the industry, from niche gaming technology firms to global entertainment conglomerates. The multi-year trend shows a sector that contracted sharply in 2022–2023 under post-pandemic debt and interest rate pressures, then rebounded steadily — suggesting improving balance sheet discipline across the ranking table.
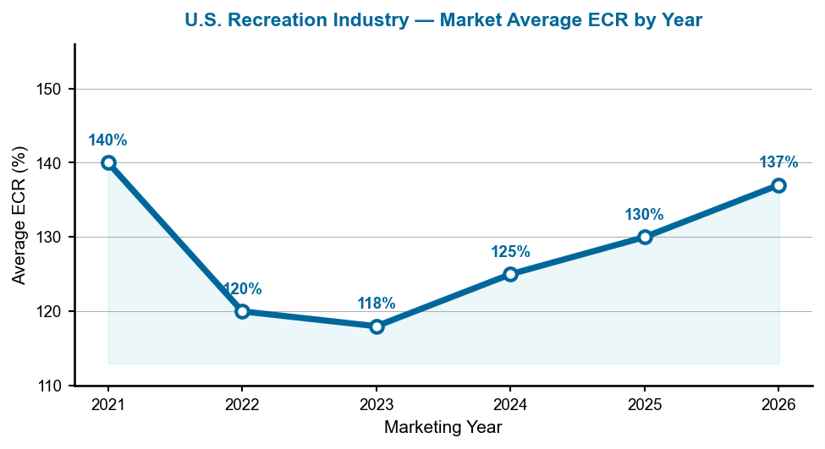
Figure 11 — Average ECR for the US recreation industry, marketing years 2021–2026.
This line chart traces the market average ECR from 2021 to 2026. The dip to 118% in 2023 coincided with rising interest rates and lingering pandemic-era debt on entertainment balance sheets. The steady recovery to 137% in 2026 reflects deleveraging, improved pricing power at theme parks and live events, and the exit of weaker players from the ranking universe.
Notable Movers
Safespace Global Corp surged 16 positions to reach rank six (ECR 151%) — the most dramatic climb in the sector, signaling a rapid improvement in capital structure. Sphere Entertainment Co entered the top ten and secured a Top Rated seal at 173%, reflecting the financial credibility of its landmark Las Vegas venue. Live Nation Entertainment rose three spots to fifth (155%), benefiting from record touring revenues and disciplined capital allocation. At the other end, Scworx Corp slipped two positions to eighth (145%), the only top-ten company to decline.
Manager’s Takeaway
The 2026 US recreation industry rankings deliver a clear message: financial resilience has little to do with fame or scale. Table TRAC INC, a $14 million gaming technology firm, outranks Walt Disney — the world’s largest entertainment company — by virtue of a near-zero-debt balance sheet and consistent profitability. Disney demonstrates that massive scale and conservative leverage can coexist. And Parks America proves that even a small safari park operator can rank among the strongest in the sector through disciplined capital management. For investors and analysts, the RealRate ECR offers a powerful signal: the companies that control debt, manage costs, and grow equity faster than their asset base consistently sit at the top of the table — year after year.