U.S. Consulting Rankings 2026: The Nuclear Fuel Company That Topped an Industry It Doesn’t Work In
Zero revenues, clean balance sheets, and a cybersecurity contractor — RealRate’s 2026 U.S. Consulting Rankings reveal an industry where business model is no barrier to financial strength.
Introduction
The U.S. consulting industry is a broad segment covering management advisory, technology services, professional staffing, government contracting, pharmaceutical services consulting, and specialized corporate functions. Consulting and advisory services in the U.S. generated an estimated $90–$100 billion in revenues in 2025, spanning global firms with thousands of employees down to highly specialized operators serving niche markets. The 18 companies in RealRate’s 2026 ranking represent that wide diversity — from an energy technology developer with no commercial revenues to a cybersecurity government contractor.
RealRate’s 2026 rankings use the Economic Capital Ratio (ECR) to measure true financial resilience. Based on audited balance sheet data for fiscal year 2025, the ECR divides a company’s economic value by its total assets — making fair comparison possible across companies of vastly different sizes, business models, and revenue profiles. The 2026 market average ECR for U.S. consulting is 136%, up from 129% in 2025, reflecting improving balance-sheet discipline across the sector after several years of narrowing margins.
2026 Rankings at a Glance
Lightbridge Corp claimed the top spot with an ECR of 254% — 118 percentage points above the market average. Pharma Bio Serv Inc came in second at 239%, and Castellum Inc completed the top three at 225%. All three are comfortably above the 136% benchmark. The figures were cross-checked against both the JSON and HTML data tables in the RealRate archive, and they are consistent across both sources.
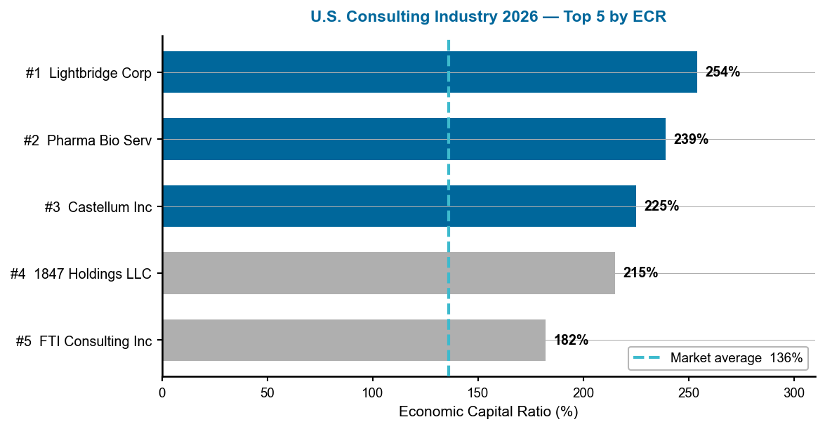
Figure 1 — U.S. Consulting Industry 2026: Top 5 companies by ECR. Dashed line = 136% market average. Source: RealRate Archive (JSON, 2025).
Reading this chart: each bar shows a company’s ECR — the longer the bar, the stronger the balance sheet relative to assets. The dashed line at 136% is the market average for 2026; every company in the top five clears it. What stands out is that Lightbridge Corp (254%) leads a tight cluster — only 72 percentage points separate first from fifth — reflecting a sector where several firms have genuinely robust financial structures, even if for very different reasons.
A Multi-Year Story
Pharma Bio Serv Inc is the ranking’s most consistent performer: it has held a top-three position in every year where data is available, its ECR ranging between 225% and 239% across four marketing years. That stability reflects a business model built on equity strength and controlled liabilities rather than revenue growth. Lightbridge Corp’s trajectory is more dramatic: it ranked third in 2024, disappeared from the upper tier in 2025 as Hestia Insight Inc briefly dominated with a 337% ECR, and returned to claim first place in 2026 with its strongest-ever score of 254%. Castellum Inc is a new entrant at third place — a government services and cybersecurity firm that makes its debut in the top three after building its balance sheet through several acquisitions.
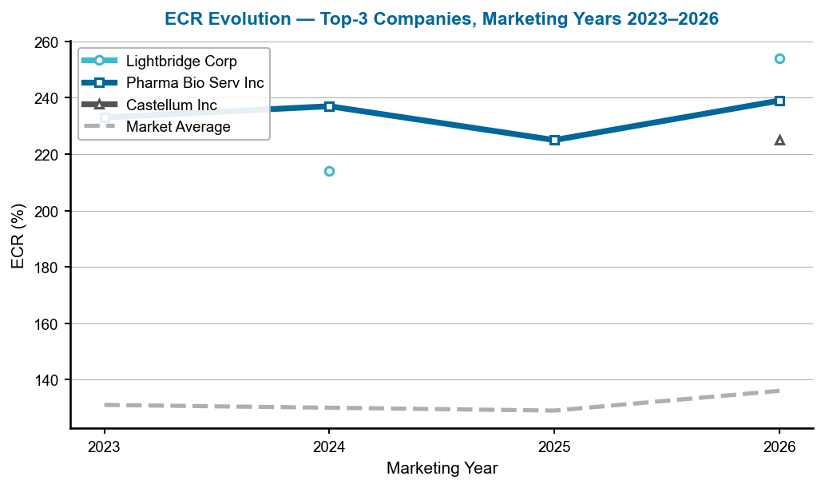
Figure 2 — ECR evolution of the top-3 companies, marketing years 2023–2026. Gaps indicate years where data were not available for that company. Source: RealRate Archive.
Reading this chart: each line traces a company’s ECR across marketing years — upward movement signals improving capital strength. The dashed grey line is the market average. Pharma Bio Serv’s line is notably stable and elevated throughout, barely deviating across four years — an unusual pattern that reflects a business with few liabilities and a steady equity base. Lightbridge’s gap in 2025 (visible as a missing data point) reflects its absence from the upper tier that year, making its 2026 return to first place more striking. Castellum Inc’s single data point in 2026 signals a new entrant that may establish its own trend in coming years.
Company Profiles
1. Lightbridge Corp — The Equity-Only Energy Developer at the Top of Consulting
Lightbridge Corp is a nuclear fuel technology company developing advanced metallic fuel assemblies for existing and next-generation nuclear reactors, including high-assay low-enriched uranium (HALEU) fuel. It is classified under consulting for SEC reporting purposes due to its advisory and licensing model. Crucially, Lightbridge reported zero revenues in fiscal 2025 — the company is entirely pre-commercial, operating on equity financing. Total assets of $203.8 million are matched against just $847,000 in liabilities, leaving equity of $203.0 million. Net income was −$19.6 million, reflecting ongoing R&D and operating costs.
Lightbridge’s exceptional ECR score flows almost entirely from its balance sheet structure: stockholders’ equity alone lifts the ratio 156 percentage points above the industry average, and its very low current liabilities add a further 119 points. The main drag is revenues — being pre-commercial, the company has no income stream, reducing the ECR by 37 percentage points. The net result is an ECR of 254%, placing Lightbridge 118 points above the market average and at the top of an industry it does not commercially participate in.
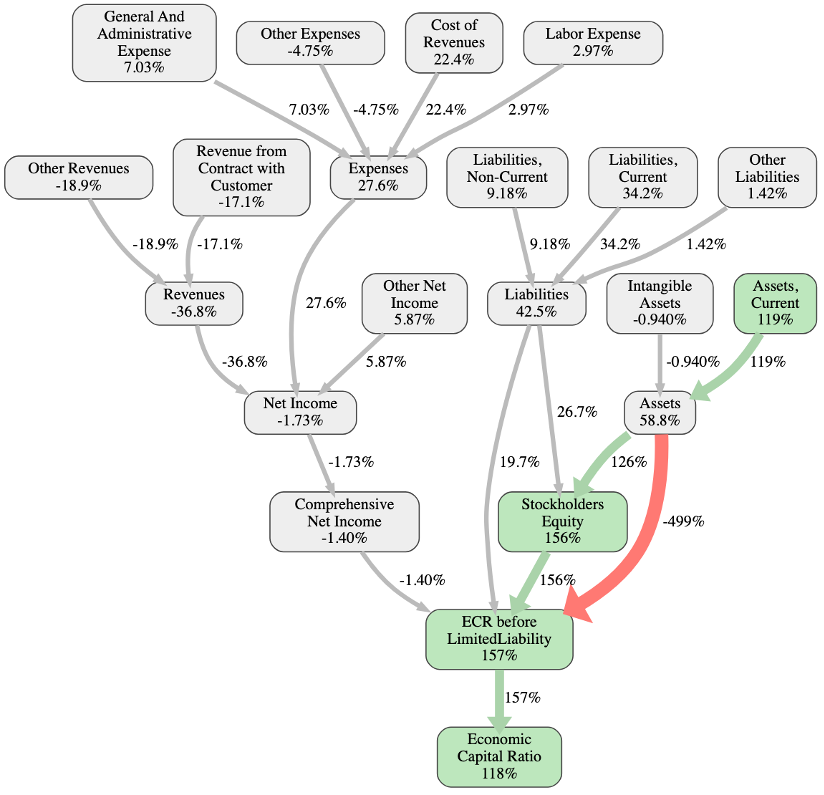
Figure 3 — Lightbridge Corp: causal ECR graph. Each node shows the effect (in ECR percentage points) of that variable relative to the industry average. Green paths boost ECR; red paths reduce it. Source: RealRate Archive.
This causal graph traces the financial chain from individual balance-sheet items down to Lightbridge’s final ECR. The dominant feature is Stockholders’ Equity (+156 pp) flowing through to the ECR — the result of a company that has raised substantial capital without accumulating debt. Assets, Current (+119 pp) reinforces the same story. On the negative side, the absence of revenues cascades through the income statement: Revenues (−37 pp) and Other Revenues (−19 pp) reflect a development-stage business with no commercial operations. Net Income (−2 pp) is a minor drag given the pre-commercial stage. The overall picture is a company whose financial strength is structural — built on clean financing — not operational.
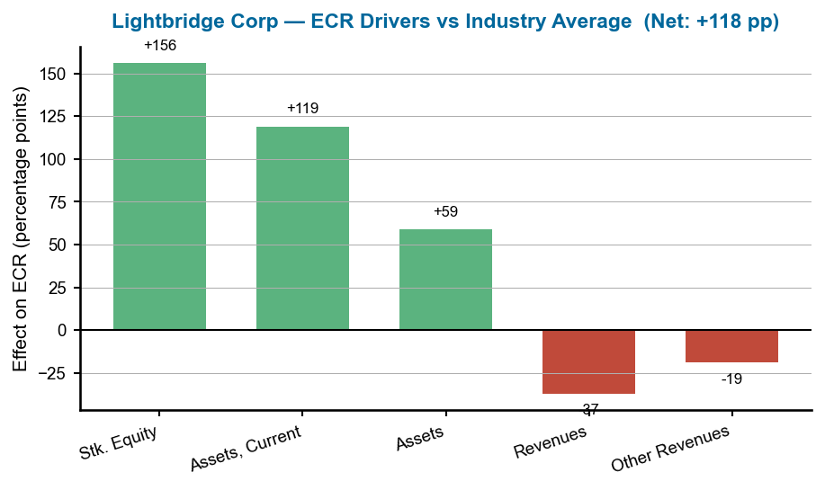
Figure 4 — Lightbridge Corp: ECR drivers versus industry average. Each bar shows a variable’s effect on ECR in percentage points; green = positive, red = negative. Source: RealRate Archive.
The effects chart quantifies each driver. Stockholders’ Equity (+156 pp) is by far the dominant force, with current assets contributing a further +119 pp — both stemming from the company’s equity-funded cash position. Total Assets (+59 pp) adds a smaller but meaningful contribution. On the negative side, the complete absence of revenues (−37 pp) and limited supplementary income (−19 pp) represent the structural cost of being pre-commercial. This company’s placement at first position is not a story of business success but of financial architecture: an extremely lean liability profile in a sector where many companies carry significant debt.
2. Pharma Bio Serv Inc — The Quiet Consistent Performer
Pharma Bio Serv Inc is a Puerto Rico-based pharmaceutical and biotechnology consulting and services company providing regulatory, validation, and compliance services to pharmaceutical manufacturers. In fiscal 2025 it reported revenues of $9.5 million against a lean cost base, with a net loss of $100,000 — effectively break-even. Total assets of $13.7 million are matched against just $1.7 million in liabilities, leaving equity of $11.9 million. The company is small by any absolute measure, but its balance sheet is exceptionally clean.
Pharma Bio’s ECR is driven by a combination of revenue structure and equity strength: Other Revenues lifts the ratio 94 percentage points above the industry average, while net income adds 46 points and stockholders’ equity contributes a further 35 points. The main headwind is liabilities — while modest in absolute terms, they reduce the ECR by 70 percentage points relative to the industry. Cost of revenues takes off a further 29 points. The net result is an ECR of 239%, placing Pharma Bio 103 points above the market average and sustaining a top-three position it has held for four consecutive years.
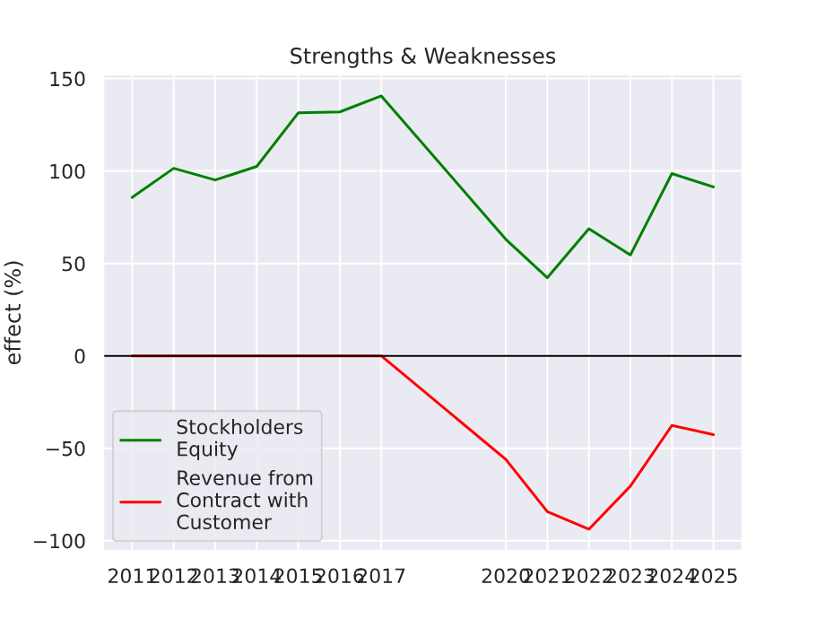
Figure 5 — Pharma Bio Serv Inc: strengths and weaknesses over time, marketing years 2011–2026. Green line = Other Revenues effect; red line = Revenue from Contract effect. Source: RealRate Archive.
This chart tracks Pharma Bio Serv’s two most influential ECR drivers across fifteen years. The green line (Other Revenues strength) shows a notable upswing from 2020 onward — a period when non-contract revenue streams expanded significantly, driving the company’s sustained top-tier performance. The red line (Revenue from Contract weakness) has followed a parallel trajectory: rising alongside Other Revenues but consistently representing the biggest drag on the ECR. The pattern suggests a company that has consciously shifted its revenue mix toward higher-margin non-contract work while its contracted-revenue base has also grown — creating a structural tension that explains both the company’s strength and its main vulnerability.
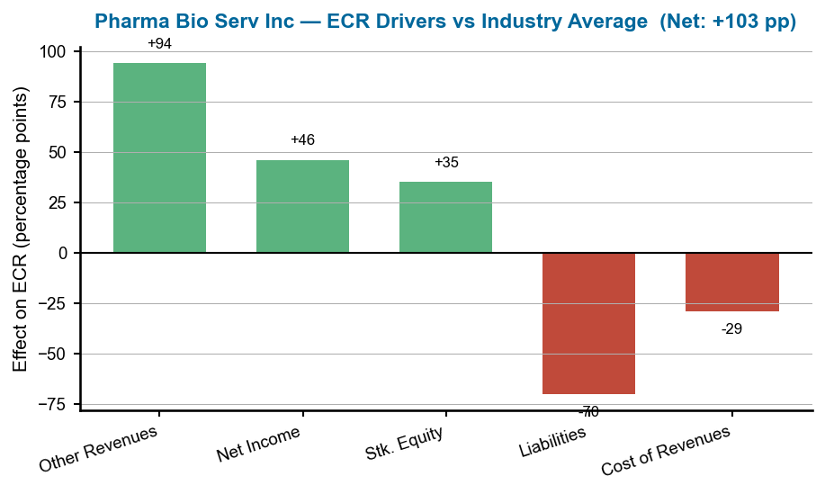
Figure 6 — Pharma Bio Serv Inc: ECR drivers versus industry average. Each bar shows a variable’s effect on ECR in percentage points; green = positive, red = negative. Source: RealRate Archive.
The effects chart for Pharma Bio Serv reveals a company with multiple genuine positive drivers — not just one dominant factor. Other Revenues (+94 pp) is the largest, reflecting income streams that significantly outperform the industry average. Net Income (+46 pp) and Stockholders’ Equity (+35 pp) add meaningful contributions of their own. The negative side is led by Liabilities (−70 pp) — a sign that even Pharma Bio’s modest debt position is higher than the leanest peers — and Cost of Revenues (−29 pp). Together the positive drivers outweigh the negatives by 103 percentage points, producing an ECR of 239% and the sector’s most consistently above-average result.
3. Castellum Inc — The Government Contractor Making Its Top-Three Debut
Castellum Inc is a U.S. government services company providing cybersecurity, IT modernization, and professional services to federal agencies. It has grown through a series of acquisitions of small government contractors. In fiscal 2025 it reported revenues of $52.9 million — the largest revenue base of the three top-ranked companies — against costs that produced a net loss of $2.4 million. Total assets of $41.9 million are set against $6.2 million in liabilities, leaving equity of $35.8 million.
Castellum’s ECR is led by Other Revenues, which pushes the ratio 139 percentage points above the industry average — the single largest positive effect among the three top-ranked companies. Net income adds 67 points and stockholders’ equity contributes 64 points. The main drags are Revenue from Contract (−66 pp) and Cost of Revenues (−64 pp), reflecting the margin pressure inherent in government contracting. The net result is an ECR of 225%, placing Castellum 89 points above the market average and making it the ranking’s most operationally active company in the top three.
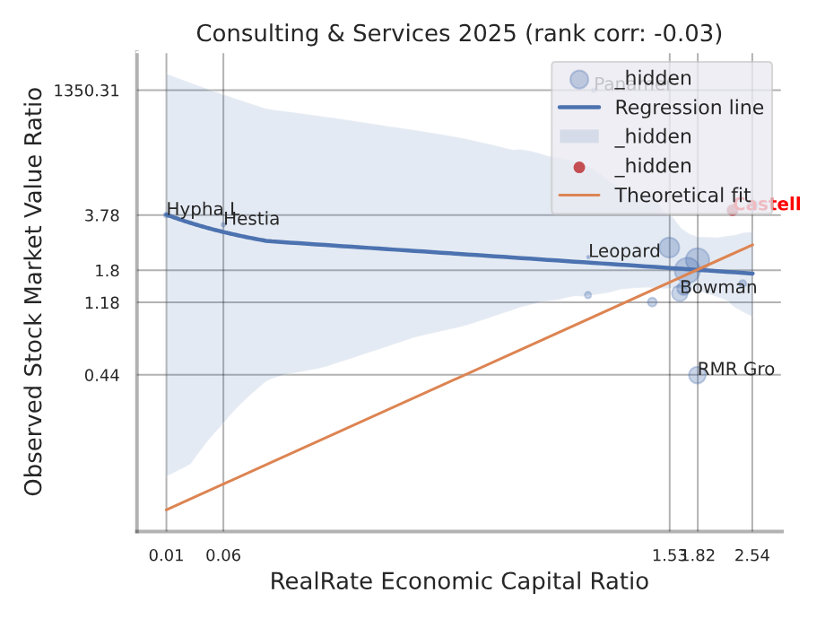
Figure 7 — Castellum Inc: individual backtesting correlation — RealRate ECR vs. observed market value ratio (red dot marks Castellum’s position). Source: RealRate Archive.
This company-specific scatter plot places Castellum’s red dot against all 18 ranked companies on two axes: the X-axis shows RealRate’s ECR model output; the Y-axis shows each company’s observed market value ratio. Castellum sits in the mid-range of both axes, positioned close to the regression line — indicating that the market values Castellum broadly in line with what its ECR would predict. This is a positive signal: it suggests neither a significant undervaluation nor an inflated market premium, and that the market is pricing Castellum’s financial fundamentals accurately.
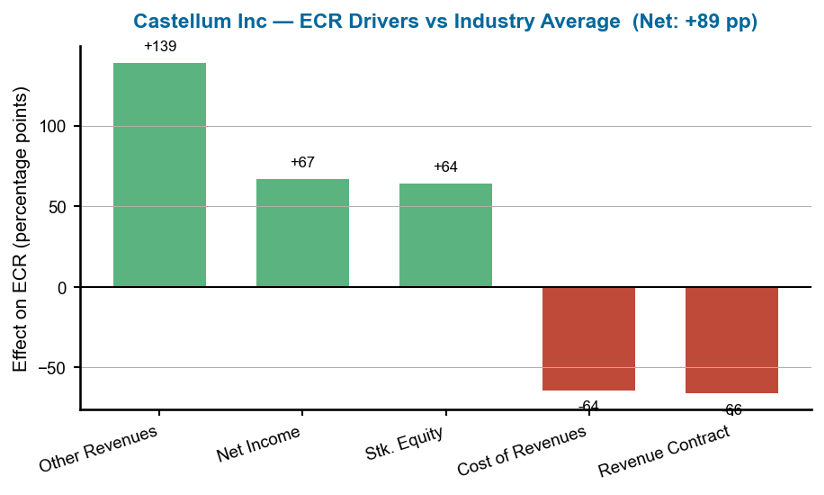
Figure 8 — Castellum Inc: ECR drivers versus industry average. Each bar shows a variable’s effect on ECR in percentage points; green = positive, red = negative. Source: RealRate Archive.
Castellum’s effects chart has the most balanced profile of the three. Other Revenues (+139 pp) is an exceptional positive outlier — more than double the second-largest driver — reflecting income streams that set Castellum apart from pure-contract competitors. Net Income (+67 pp) and Stockholders’ Equity (+64 pp) add solid contributions, showing that the company’s acquisitive growth strategy has produced genuine equity accumulation. Revenue from Contract (−66 pp) and Cost of Revenues (−64 pp) are the counterweights — the structural costs of operating primarily through government contracts. The net balance of +89 pp confirms that Castellum’s strengths more than cover its weaknesses.
What Drives Financial Strength in U.S. Consulting?
RealRate’s model traces ECR through a causal chain of financial-statement variables, and for the U.S. consulting sector the primary driver is earnings quality: Comprehensive Net Income carries a 75% importance weight in the model, with Stockholders’ Equity contributing a further 31%. In plain terms, what separates the financially strongest consulting firms from the weakest is not balance-sheet size or asset composition — it is the quality of earnings and the strength of the equity base. This explains how a pre-commercial nuclear fuel developer with zero revenues can outrank active advisory businesses: its equity base is simply enormous relative to its assets.
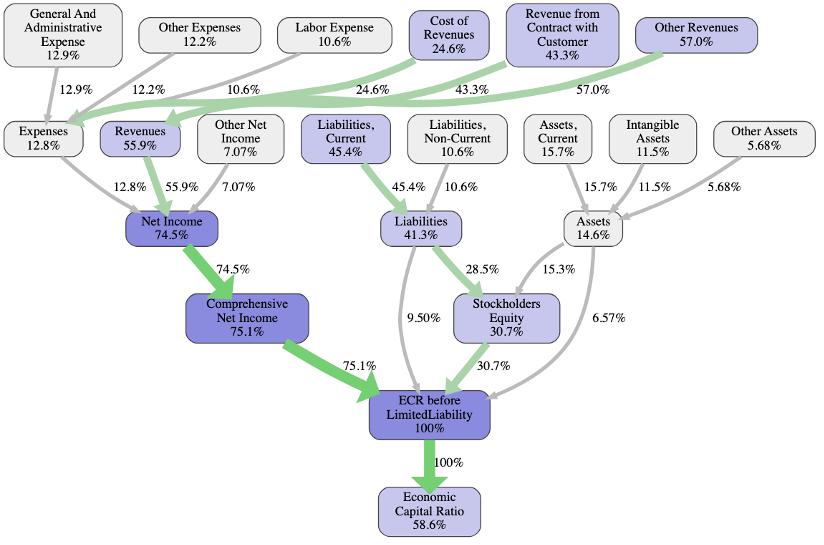
Figure 9 — U.S. Consulting Industry: feature-importance graph (industry-level). Percentages on each arrow show how strongly that variable’s importance carries through to the Economic Capital Ratio. Source: RealRate Archive.
This flow diagram traces individual financial-statement items down through aggregated variables to the final ECR, with each arrow’s percentage showing relative weight in the model. Comprehensive Net Income (75%) is the dominant channel — meaning that across the 18 ranked firms, earnings quality is the most powerful predictor of financial strength. Stockholders’ Equity (31%) is the second strongest driver, and Labour Expense (11%) is notably higher than in asset-heavy industries, reflecting the people-intensive nature of consulting. Balance-sheet items like Intangible Assets (12%) and Other Assets (6%) have comparatively little influence on the final score.
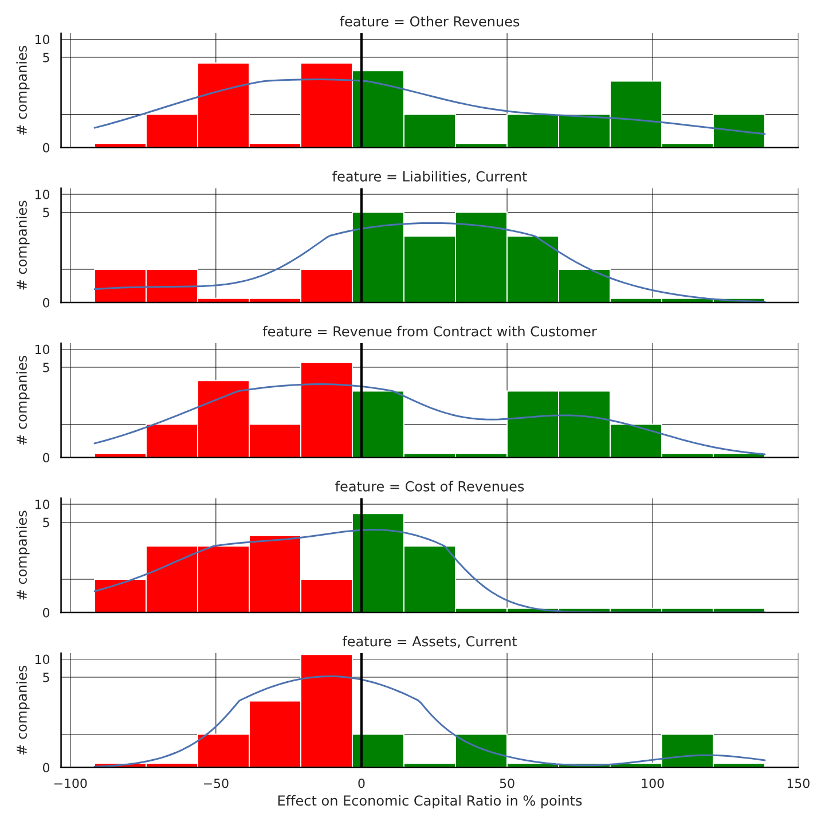
Figure 10 — U.S. Consulting Industry: feature-distribution plot (industry-level). Each panel shows how one variable’s effect on ECR is spread across all ranked companies. Source: RealRate Archive.
This industry-wide distribution (no black company arrow) shows how five key variables’ effects on ECR are spread across the 18 ranked firms. The distributions are notably clustered near zero for most companies, with a few clear outliers at the tails. Other Revenues shows the widest spread — some firms generate outsized non-contract income (like Pharma Bio Serv and Castellum) while others generate none at all. Current Liabilities and Revenue from Contract cluster more tightly, indicating that most consulting firms are broadly similar in how these variables affect their ECR. The pattern reflects a sector with a homogeneous core but significant differentiation at the top.
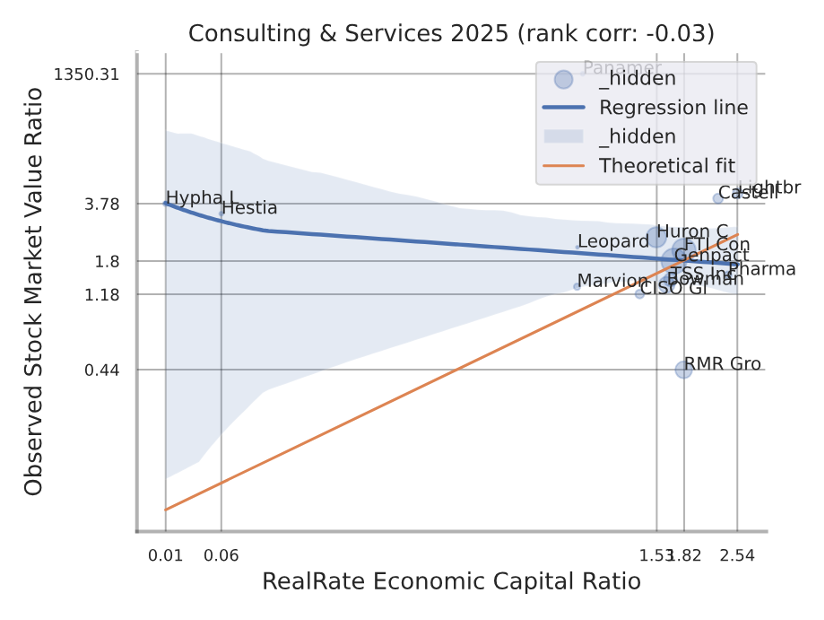
Figure 11 — U.S. Consulting Industry: backtesting correlation — RealRate ECR vs. observed market value ratio (industry-level). Source: RealRate Archive.
This industry-level scatter plot (no red dot, as no single company is highlighted) shows the relationship between RealRate’s ECR output and each firm’s observed market valuation. The cluster reflects the diversity of the sector: pre-commercial companies like Lightbridge Corp sit at the far right of the ECR axis (highest ECR) while their market valuation may reflect growth expectations unrelated to current capital ratios. The wide spread on the Y-axis — from near-zero to very high market values — illustrates how consulting encompasses both deeply undervalued operators and highly premiumised advisory firms. RealRate’s ECR captures current capital strength; market valuations in this sector can diverge significantly based on future revenue expectations.
Market Statistics
The average ECR across the 18 U.S. consulting companies in 2026 is 136% — up from 129% in 2025 and the first increase after three consecutive years of decline from a 2022 high of 145%. The moderate recovery suggests that the consulting sector is gradually rebuilding balance-sheet strength after a period of margin pressure and elevated costs. The gap between the market average (136%) and the top-ranked company (254%) is 118 percentage points — wide, but narrower than in some prior years when a single outlier dominated the ranking by a much larger margin.
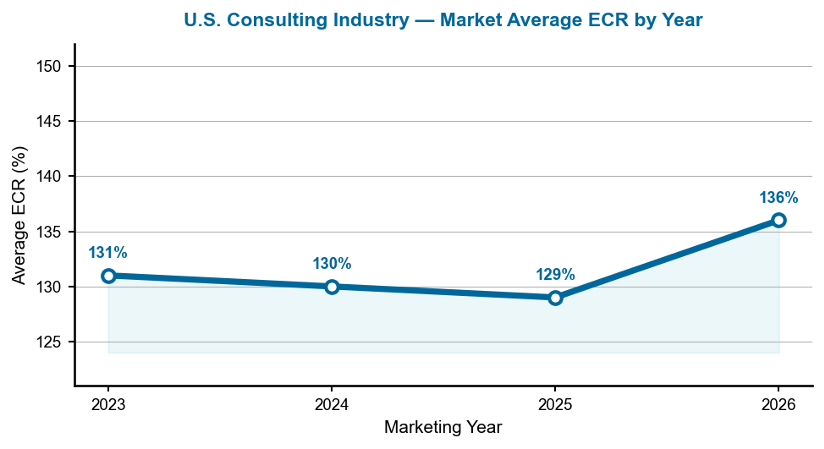
Figure 12 — Average ECR for the U.S. consulting industry, marketing years 2023–2026.
This line chart traces the market average ECR from 2023 to 2026. The gradual decline from 131% in 2023 to 129% in 2025 — while modest — reflects a sector navigating tighter cost conditions, with several firms either leaving the ranking or reporting lower equity ratios. The uptick to 136% in 2026 is encouraging: it suggests the firms remaining in the ranking have collectively strengthened their balance sheets. For investors, the 136% average means that the typical U.S. consulting firm’s economic value exceeds its total assets by 36% — a respectable cushion but one that varies considerably across the sector.
Notable Movers
Lightbridge Corp’s return to first place is 2026’s headline story: after dropping from third in 2024 to outside the upper tier in 2025 — when Hestia Insight Inc dominated with a 337% ECR — Lightbridge reclaimed the top spot with its strongest result on record. Hestia Insight Inc, last year’s leader, disappears from the top four entirely in 2026, an example of how small-company ECR scores can shift sharply as their limited asset bases and equity positions evolve. Castellum Inc’s arrival in third place is the year’s most significant new entry: a growing government contractor that has converted a series of acquisitions into a balance sheet strong enough to compete with the sector’s perennial top performers. FTI Consulting Inc, the only large-cap firm in the top five, reached fifth place — a steady improvement from ninth in 2021, confirming that even the ranking’s biggest company by revenue is building genuine financial resilience.
Manager’s Takeaway
The 2026 U.S. consulting rankings deliver an unexpected lesson: in a sector defined by intellectual capital and client billings, the companies with the strongest financial structures are not necessarily the ones with the most revenues. Lightbridge Corp has no revenues at all, yet leads 18 firms because its equity base is overwhelmingly larger than its liabilities. Pharma Bio Serv has generated a top-three ECR for four consecutive years on under $10 million in annual revenues. Castellum, the only operationally scaled company in the top three, shows that growth through acquisition can build a competitive balance sheet — if debt remains controlled. The consistent message across all three: financial strength in consulting flows from equity discipline and liabilities management far more than from revenue scale. Companies that control what they owe, not just what they earn, tend to sit at the top of the table, year after year.