Introduction
The US computer hardware and networking sector generates over $500 billion in annual revenue, anchoring the global technology supply chain from semiconductors and consumer devices to enterprise networking infrastructure and cybersecurity appliances. It is a sector defined by rapid innovation, intense capital cycles, and winner-take-most market dynamics.
RealRate’s 2026 rankings use the Economic Capital Ratio (ECR) to measure true financial resilience. Based on audited balance sheet data for fiscal year 2025, the ECR divides a company’s economic value by its total assets — enabling fair comparisons across vastly different company sizes. The 2026 market average ECR for the US computer sector stands at 258%, reflecting the sector’s generally strong capital positions relative to other industries. The ranking covers 17 companies tracked over balance sheet years 2009–2025.
2026 Rankings at a Glance
Apple Inc reclaimed the top spot with an ECR of 430% — 172 percentage points above the industry average. Arista Networks Inc held strong at second (405%), while Wetouch Technology Inc — the year’s best newcomer to the ranking — secured third at 387%. All three comfortably outpace the 258% benchmark. The rankings were cross-checked between the HTML table at realrate-archive.com/us_computers/qa/ and the JSON source at realrate-archive.com/us_computers/2025/website-ranking.json — both sources agree on all values.
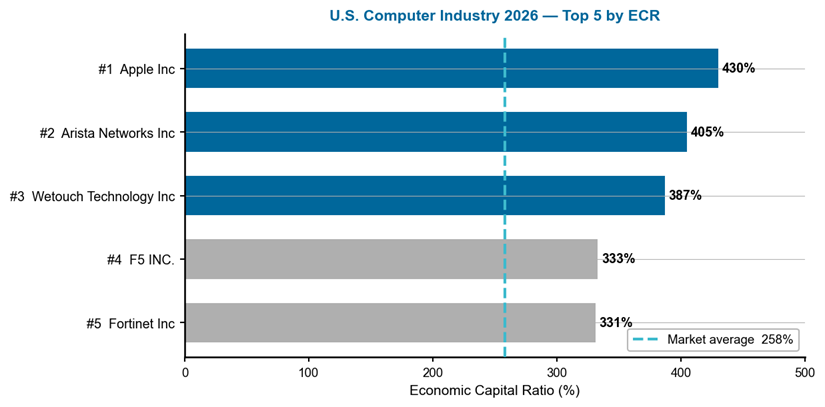
Figure 1 — US Computer Industry 2026: Top 5 companies by ECR. Dashed line = 258% market average. Source: RealRate Archive (JSON, 2025).
Reading this chart: The horizontal bars show each company’s ECR; longer bars mean greater financial strength. The dashed line is the market benchmark. Apple leads at 430%, nearly 100 percentage points ahead of fourth-ranked F5 INC. (333%). The gap between the top three and the rest illustrates the concentration of capital strength among tech leaders with dominant market positions and lean balance sheets.
A Multi-Year Story
Arista Networks led the industry in marketing years 2023–2025 with ECR values of 434%, 450%, and 438% respectively, before Apple overtook it in 2026 with a new peak of 430%. Wetouch Technology debuted at an extraordinary 485% in 2021, peaked at 576% in 2022, then dropped sharply to 329% in 2023 — before recovering to 387% in 2026 after a year of missing data. Apple’s own trajectory shows steady growth from 339% in 2021 to 430% in 2026, a sustained climb that reflects a decade of balance sheet optimization and profit growth.
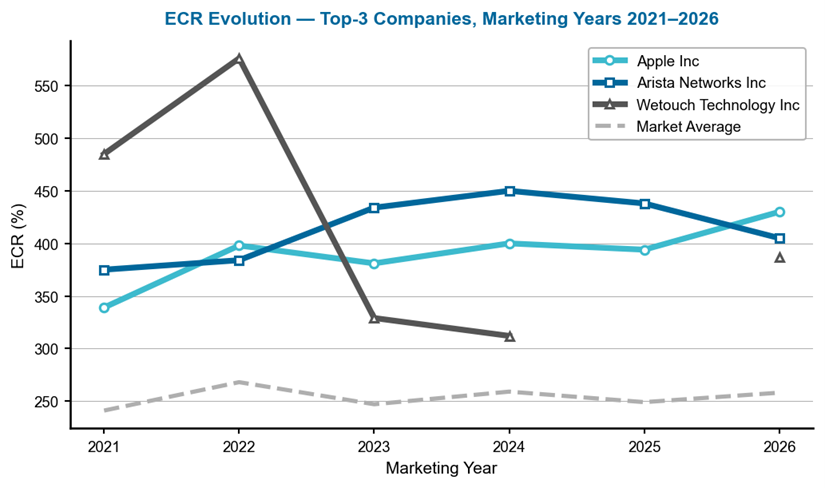
Figure 2 — ECR evolution of the top-3 companies, marketing years 2021–2026. Gaps indicate years where data were not available for that company. Source: RealRate Archive.
Reading this chart: Each line traces a company’s ECR across marketing years — rising lines signal improving capital strength. The dashed grey line is the market average. Wetouch’s volatile trajectory — from 576% to 312% and back to 387% — contrasts sharply with Apple’s gradual ascent and Arista’s consistently high plateau. The market average itself has remained stable around 250%, suggesting the sector’s capital base is mature and well-managed overall.
1. Apple Inc — The Profit Engine Returns to the Top
Apple Inc is the world’s most valuable technology company, designing and selling consumer electronics, software, and services across a global ecosystem. Based in Cupertino, California, the company reported revenues of $416.2 billion against expenses of $303.8 billion in fiscal 2025, generating net income of $112.0 billion. Total assets stand at $359.2 billion against liabilities of $285.5 billion — leaving equity of $73.7 billion. While Apple’s equity-to-assets ratio appears modest, its exceptional profitability drives an ECR of 430%.
Apple’s greatest ECR driver is net income: profitability alone pushes the ratio 245 percentage points above the industry average — an extraordinary figure reflecting $112 billion in annual earnings. Administrative and marketing expense control adds a further 199 points, while revenues contribute 175 points. The main drag is costs of goods sold at −160 points, the price of manufacturing at scale. The net result is an ECR of 430%, placing Apple 172 points above the market average and demonstrating that sheer profit generation can overcome even a leverage-heavy balance sheet.
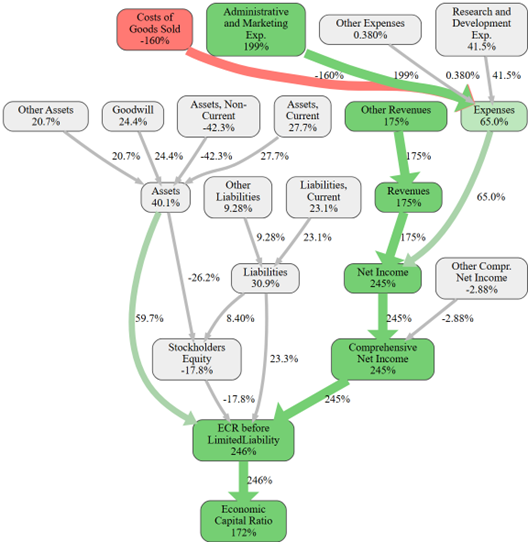
Figure 3 — Apple Inc: causal ECR graph. Each node shows the effect (in ECR %-points) of that variable relative to the industry average. Green paths boost ECR; red paths reduce it. Source: RealRate Archive.
This causal graph reveals Apple’s financial architecture. Net Income at +245 pp is the dominant positive node — the single largest effect in the entire ranking. Administrative and Marketing Expenses at +199 pp reflect Apple’s relatively lean selling costs for a company of its revenue scale. Revenues at +175 pp confirm the company’s pricing power. Costs of Goods Sold at −160 pp is the primary drag, reflecting the hardware manufacturing cost base. The final node shows an ECR 172 pp above market average.
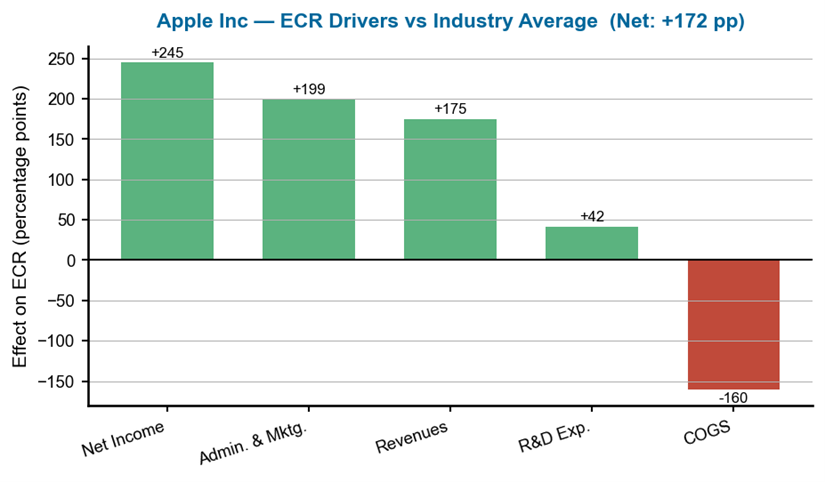
Figure 4 — Apple Inc: ECR drivers versus industry average. Each bar shows a variable’s effect on ECR in percentage points; green = positive, red = negative. Source: RealRate Archive.
The effects chart confirms Apple’s profit-driven model: Net Income at +245 pp is the standout driver, followed by Administrative and Marketing Expenses at +199 pp and Revenues at +175 pp. R&D Expenses add a moderate +42 pp, reflecting Apple’s efficient innovation spending relative to its output. The single red bar — Costs of Goods Sold at −160 pp — is substantial but dwarfed by the combined positive effects. The net +172 pp above market average confirms Apple’s position as the sector’s most capital-efficient company.
2. Arista Networks Inc — The Cloud Networking Powerhouse
Arista Networks designs and sells cloud networking solutions for data centers and campus environments, serving hyperscale cloud providers and large enterprises. Revenues of $9.0 billion and net income of $3.5 billion in fiscal 2025 reflect one of the most profitable business models in enterprise tech. Total assets of $19.4 billion are matched against just $7.1 billion in liabilities, leaving equity of $12.4 billion — a clean balance sheet underpinning its second-place ranking.
The greatest ECR driver is net income, contributing 193 percentage points above the industry average. Administrative and marketing expense control adds 105 points, reflecting Arista’s lean go-to-market model. The main weakness is current assets at −62 points, driven by a large cash and investments position that, while positive for liquidity, dilutes the ECR relative to the average. With an ECR of 405% — 147 points above the benchmark — Arista demonstrates that premium margins in networking equipment translate directly into capital strength.
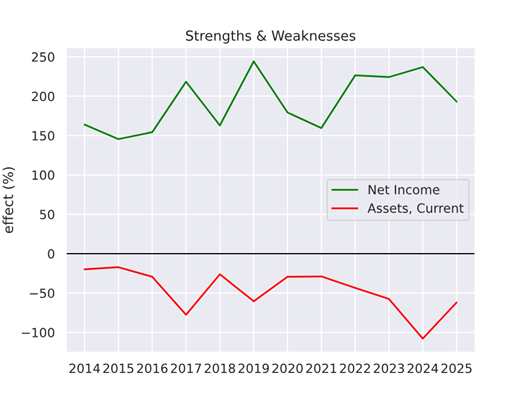
Figure 5 — Arista Networks Inc: ECR strengths and weaknesses over time. Positive values (green) boost ECR; negative values (red) reduce it. Source: RealRate Archive.
Arista’s strengths-and-weaknesses chart shows a remarkably stable positive pattern across the observed period. Net income and expense control have been persistently strong, while the current assets drag has been consistent but contained. The stability of this profile signals a business model with durable structural advantages — Arista’s position in cloud networking is protected by high switching costs and deep customer relationships with the largest cloud providers.
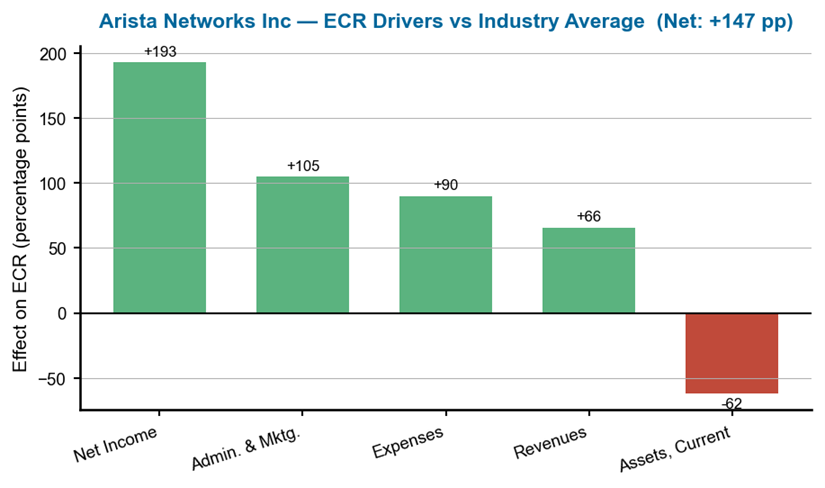
Figure 6 — Arista Networks Inc: ECR drivers versus industry average. Source: RealRate Archive.
The effects chart confirms Arista’s twin-pillar story: Net Income at +193 pp and Administrative & Marketing Expenses at +105 pp together account for the vast majority of its ECR advantage. Operating Expenses add +90 pp and Revenues +66 pp. The Current Assets drag at −62 pp is the only material negative, reflecting Arista’s substantial cash reserves. The net +147 pp above market average illustrates why Arista has held a top-three position across multiple consecutive years.
3. Wetouch Technology Inc — The Micro-Cap Newcomer
Wetouch Technology is a China-based manufacturer of touch screen display modules and integrated circuits, listed on US exchanges. With revenues of just $45,000 and net income of $7,200 in fiscal 2025, it operates at a fraction of the scale of its ranking peers. However, total assets of $141,000 against liabilities of just $3,200 — leaving equity of $137,400 — give it an extraordinarily clean balance sheet that drives its high ECR.
Wetouch’s greatest strength is comprehensive net income, contributing 129 percentage points above the industry average. Administrative expense control adds 117 points, and the near-zero liability structure adds 60 points. The primary weakness is current assets at −144 points — a heavy drag reflecting the company’s asset-heavy balance sheet relative to its small revenue base. With an ECR of 387% — 129 points above the market average — Wetouch illustrates that even micro-cap companies with pristine balance sheets can rank among the most capital-resilient in the sector.
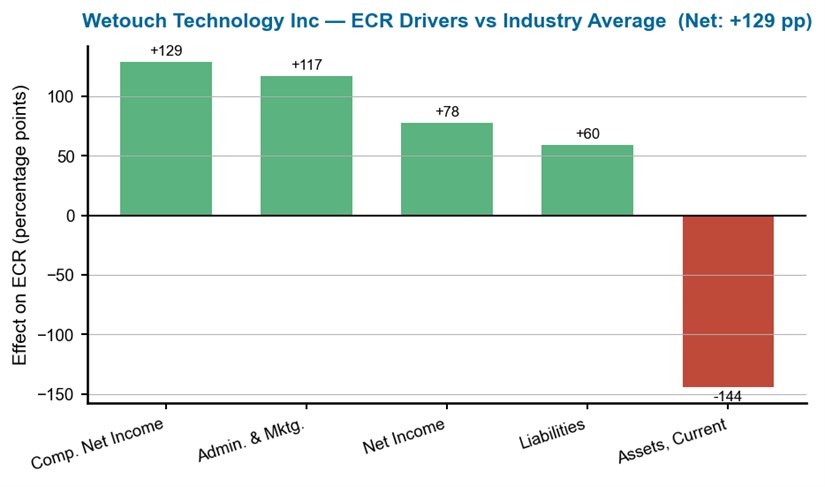
Figure 8 — Wetouch Technology Inc: ECR drivers versus industry average. Source: RealRate Archive.
Wetouch’s effects chart tells a distinctive story: Comprehensive Net Income at +129 pp and Administrative & Marketing Expenses at +117 pp are the primary drivers, reflecting the company’s lean operating structure. Liabilities at +60 pp confirm the near-zero-debt balance sheet. However, the Current Assets bar at −144 pp is the largest single negative effect in the top three — the company’s assets are overwhelmingly current, which dilutes the ECR relative to the industry norm. The net +129 pp above market average is impressive but more fragile than the steady, profit-driven advantages of Apple and Arista.
What Drives Financial Strength in Computers?
RealRate’s model identifies Comprehensive Net Income (76.8%), Net Income (76.8%), and Costs of Goods Sold (72.6%) as the three most influential variables for ECR in the US computer sector. Unlike the food industry where liability structure dominates, the computer sector is driven by profitability and cost management. Operating expenses (50.6%) and revenues (34.4%) also rank highly, while physical assets and current assets have minimal predictive power — reinforcing that it is earnings quality, not balance sheet size, that determines capital strength in tech.
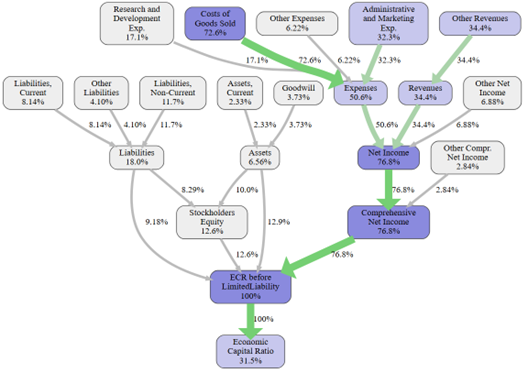
Figure 9 — US Computer Industry: feature importance for ECR prediction (industry-level, no company arrow). Source: RealRate Archive.
This feature importance chart shows which financial variables most influence ECR predictions across all computer companies. The three tallest bars — Comprehensive Net Income, Net Income, and Costs of Goods Sold — all exceed 72%, meaning profitability and manufacturing cost control are the dominant factors. Liabilities rank surprisingly low (18%), confirming that the computer sector rewards earnings power over conservative leverage. Current Assets (2.3%) and Goodwill (3.7%) are nearly irrelevant to the model.
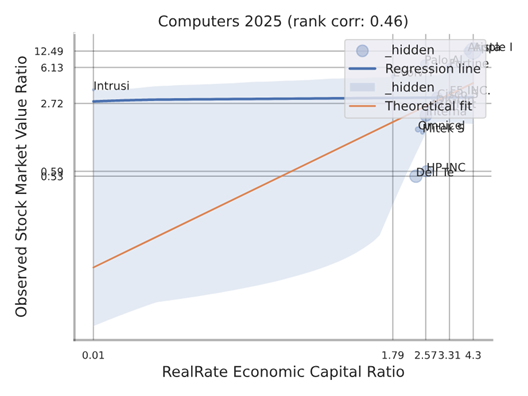
Figure 10 — US Computer Industry: backtesting correlation — RealRate ECR vs observed market value ratio (industry-level, no red company dot). Source: RealRate Archive.
This industry-level scatter plot (no red dot) shows the relationship between RealRate-calculated ECR and observed market value ratios across all computer companies. The upward-sloping regression line confirms a strong positive relationship — higher ECR scores correlate with higher market valuations. The dispersion reflects the sector’s diversity, from micro-cap specialists to trillion-dollar giants, but the overall direction validates ECR as a meaningful financial signal for the US computer industry.
Market Statistics
The average ECR across the 17 US computer companies in 2026 is 258% — broadly stable compared to 249% in 2025 and 259% in 2024. The sector’s ECR average has fluctuated between 241% and 268% over the past six marketing years, reflecting a mature industry with well-managed capital positions. The wide gap between the top performer (430%) and the bottom of the ranking (below 1%) underscores the extreme dispersion in financial strength across the sector — a pattern typical of technology industries where network effects and scale create durable advantages.
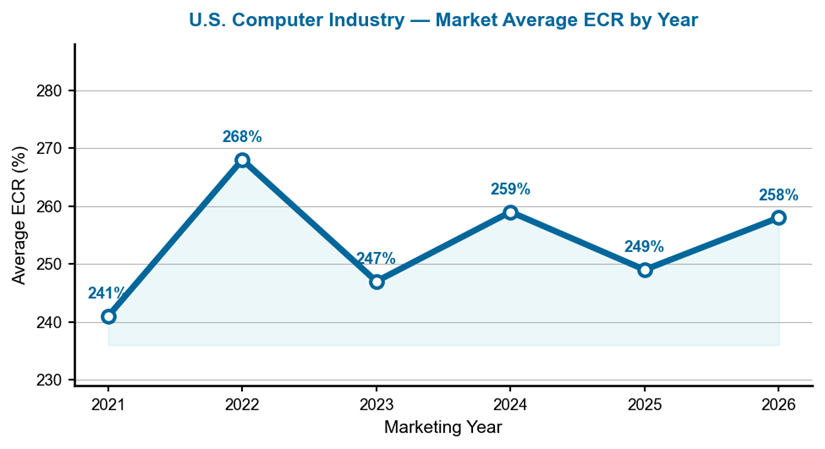
Figure 11 — Average ECR for the US computer industry, marketing years 2021–2026.
This line chart traces the market average ECR from 2021 to 2026. The peak of 268% in 2022 reflected strong post-pandemic earnings across the sector. The subsequent dip to 247% in 2023 coincided with enterprise spending pullbacks and inventory corrections. The recovery to 258% in 2026 suggests normalizing demand and improved cost discipline across the industry.
Notable Movers
Wetouch Technology is the headline newcomer, entering the 2026 ranking at third place with an ECR of 387% after missing from the 2025 data entirely. International Business Machines climbed one position from 11th to 10th, driven by improving net income. At the other end, Palo Alto Networks lost five positions — falling from 6th to 11th — due to deteriorating liability metrics. A10 Networks dropped four places from 4th to 8th, a notable slide for a company that was among the sector’s strongest just one year earlier. Apple’s rise from 2nd to 1st represents a return to the position it held across most of the 2009–2014 period.
Key Takeaway
The 2026 US computer industry rankings deliver a clear message: profitability is king. Apple’s $112 billion in annual earnings drives an ECR of 430% despite carrying $285 billion in liabilities — proof that in technology, earnings power matters more than leverage ratios. Arista Networks demonstrates that a focused cloud networking play with 39% net margins can sustain an ECR above 400% across multiple years. And Wetouch Technology proves that even a micro-cap company with minimal revenue can achieve a top-three ranking through an almost debt-free balance sheet. For investors and analysts, the RealRate ECR offers a powerful signal: the companies that generate outsized profits relative to their asset base — regardless of size — consistently sit at the top of the table.