Financial Strength Rankings of U.S. Chipmakers (2025) – Which semiconductor companies are built to last? This report dives into the latest financial strength ratings of U.S. semiconductor firms, explaining who came out on top and why. We use an Economic Capital Ratio (ECR) – a measure of a company’s economic value relative to its assets – to compare big and small players on equal footing. An ECR of 100% means a company’s economic capital equals its total assets; higher percentages indicate greater financial strength (more capital buffer per asset). RealRate’s AI-driven model crunches the companies’ financials (assets, liabilities, income, and costs) to assign each a ranking by ECR. The results for 2025 are in, and they reveal a few surprises in an industry defined by rapid growth and intense competition.
Despite recent market headwinds, the U.S. semiconductor industry’s financial performance remains robust. In 2024, global semiconductor revenue hit roughly $650 billion, rising about 20% from the prior year. U.S. chipmakers contributed significantly to this surge, thanks to soaring demand for chips in AI, automotive tech, and data centers. Many American semiconductor firms saw strong sales rebounds, boosting profits and strengthening balance sheets. This revenue growth underpins the financial health metrics we explore in our rankings.
Top 3 Semiconductor Companies – A New Pecking Order
Monolithic Power Systems, NVE Corp, and Nvidia emerge as the top three strongest semiconductor companies in 2025, according to RealRate’s financial strength model. These three firms lead the industry in Economic Capital Ratio, meaning they have unusually high economic capital relative to their asset bases – a hallmark of solid balance sheets and prudent financial management. Let’s take a closer look at each and how they earned their spots:
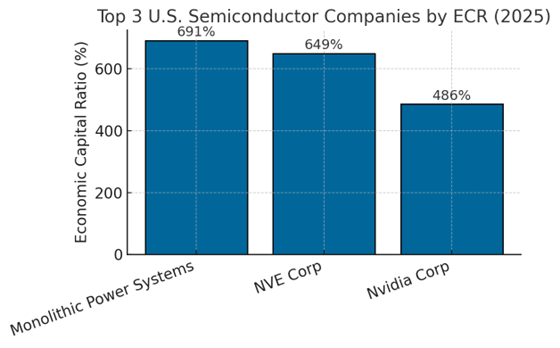
Figure 1: Economic Capital Ratio (ECR) of the Top 3 U.S. Semiconductor Companies in 2025. Higher ECR percentages indicate greater financial strength. Monolithic Power Systems leads with an ECR of about 691%, meaning its economic capital is nearly seven times its assets – an exceptionally high buffer. NVE Corp follows at 649%, and Nvidia at 486%. All three far exceed the industry’s average ECR (around 240%).
1. Monolithic Power Systems (Rank 1) – Mighty Balance Sheet, Minimal Debt
Monolithic Power Systems Inc. claims the top spot with a stunning ECR of roughly 691%, indicating it has nearly seven dollars of economic capital for every dollar of assets. This Silicon Valley-based analog chipmaker isn’t the biggest by size, but it punches far above its weight in financial solidity. What’s driving Monolithic’s strength? Its balance sheet is extremely strong – the company carries very little debt (liabilities are minimal), and it finances operations largely through equity. In the graph above, the large green equity node shows Monolithic’s shareholders’ equity is far higher than average, which positively impacts its ECR. Monolithic has consistently solid profits as well, represented by the green net income effects. High equity and steady income mean Monolithic can easily cover its obligations; in fact, it has excess capital relative to assets. Over the past few years, Monolithic Power’s rank has steadily climbed (from 8th place in 2022 to 3rd in 2023, and now 1st), as it maintained strong earnings growth and avoided piling on debt. In short, Monolithic’s conservative financial strategy – low liabilities, high equity, and healthy margins – has made it the most financially resilient U.S. semiconductor company of 2025.
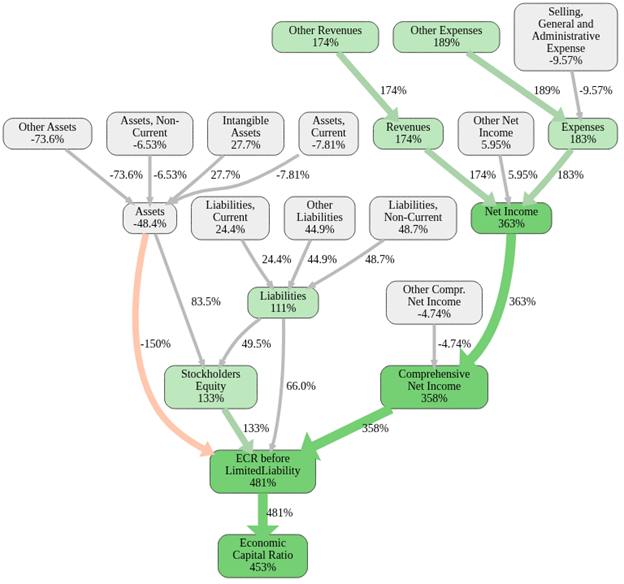
Figure 2: Causal financial graph for Monolithic Power Systems (Rank 1). Green boxes and arrows indicate strengths (above-average factors boosting the ECR), while red would indicate weaknesses (below-average factors). Monolithic’s graph is overwhelmingly green, showing robust Stockholders’ Equity (133% above the industry norm) and healthy Net Income. Low debt levels (Liabilities are modest) further boost its Economic Capital Ratio. The final node at the bottom, “Economic Capital Ratio,” is very high (around 691%), reflecting Monolithic’s exceptional capital strength.
2. NVE Corporation (Rank 2) – A Small Company with Outsized Reserves
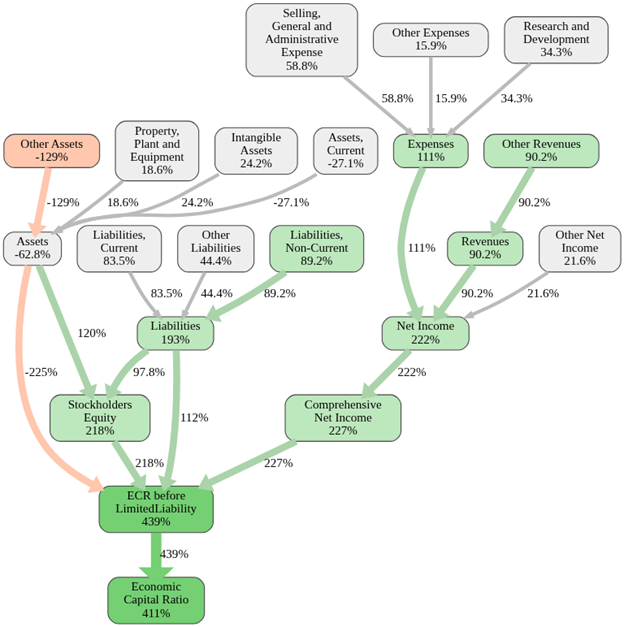
Figure 3: Causal financial graph for NVE Corp (Rank 2). NVE’s Liabilities are extremely low (green nodes), while its Stockholders’ Equity is very high relative to assets, showing a virtually debt-free company. This strong equity base (218% of the industry benchmark) and solid profitability yield an outstanding ECR. NVE’s Economic Capital Ratio (final node) is about 649%, indicating tremendous capital strength for its size.
Coming in second is NVE Corp, a niche semiconductor company that many casual tech observers might not know – but its finances are the envy of the industry. NVE is much smaller in scale than giants like Intel or Nvidia, but it has an ECR of ~649%, only slightly behind Monolithic. NVE has achieved this by running a lean, debt-free operation. The graph shows NVE’s liabilities (especially long-term liabilities) are practically nonexistent – a green highlight of “Liabilities Non-Current” at only 89% of the average indicates NVE carries less debt than most peers. Meanwhile, its Stockholders’ Equity is huge (more than double the typical level, as seen by the 218% label). In plain terms, NVE finances itself almost entirely with equity and accumulated profits, with hardly any borrowing. The company also consistently earns healthy profits from its specialized magneto-resistive memory and sensor products, keeping its income positive year after year without heavy expenses. All these factors translate to a sky-high capital ratio. NVE has been a perennial leader in financial strength – it held the #1 rank last year and remains in the top 3 this year. Its slight dip to rank 2 is not due to any weakness at NVE, but rather Monolithic Power’s even greater surge. NVE demonstrates how a smaller firm, focused on profitability and low leverage, can outperform far larger competitors in financial stability.
3. Nvidia Corporation (Rank 3) – Profit Juggernaut with Heavy Investment
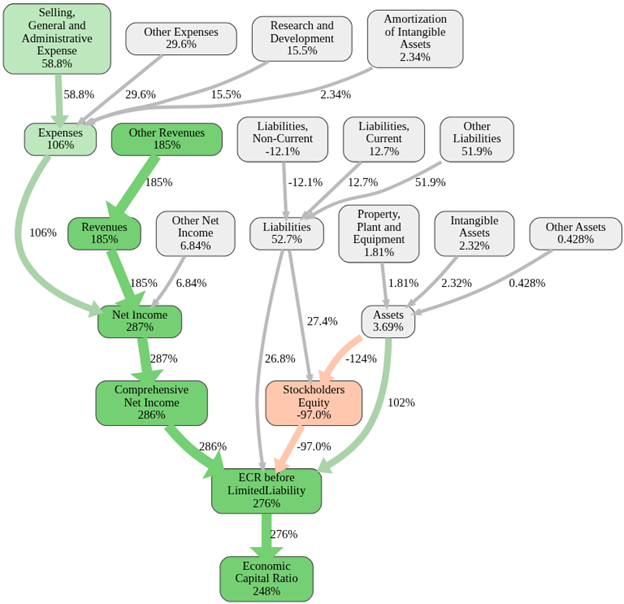
Figure 4: Causal financial graph for Nvidia (Rank 3). This diagram shows a mix of strengths and weaknesses. Nvidia’s Liabilities and Assets nodes are gray, near industry-average levels. Notably, the Stockholders’ Equity node is reddish (–97%), indicating Nvidia’s equity ratio is lower than the industry norm – a relative weakness likely due to its massive asset growth and shareholder returns. Additionally, the negative percentage on Liabilities Non-Current (–12.1%) suggests Nvidia has slightly less long-term debt than average (a small strength). Nvidia’s huge R&D and operating costs (not shown here) likely weigh on its ECR, but its enormous Comprehensive Net Income (profits) still propel it to a high final ECR (around 486%).
Rounding out the top three is a household name: Nvidia Corp. Nvidia’s inclusion near the top is a new development – it skyrocketed from rank 30 last year to rank 3 this year. The company’s ECR is roughly 486%, reflecting the incredible jump in its financial performance. How did this happen? In one word: profitability. Nvidia has had a blockbuster year driven by unprecedented demand for its AI and graphics chips, which sent its revenues and net profits to record highs. That surge in income (far above industry average) boosted its economic capital substantially. However, Nvidia’s financial profile is more complex than the smaller companies above it. The graph reveals that Nvidia’s strengths lie in its income – it generates enormous cash flows – but it also has high costs and asset growth that somewhat dilute its ECR. For instance, Nvidia invests heavily in research & development and acquisitions (leading to large assets and expenses), and it has returned capital to shareholders (which can reduce equity on the books). The equity box in Nvidia’s graph is shown in red (–97% relative to average), hinting that relative to its size, Nvidia’s equity ratio isn’t as high as some others – the company isn’t distressed by any means (it’s fabulously profitable), but it leverages its balance sheet to grow aggressively and reward shareholders. In short, Nvidia’s net income is so high that it propels the company up the rankings, despite its heavy investment spending. This dramatic jump from 30th to 3rd underscores how quickly fortunes can change in tech: a surge in demand (in this case, AI chips) can translate into financial strength almost overnight. Nvidia’s rise also helped lift the average ECR of the industry as a whole.
Strengths and Weaknesses: How the Top 3 Succeed
Each of the top three companies has a story to tell in terms of what they do well financially and where they could improve. RealRate’s reports include detailed breakdowns of strengths and weaknesses over time for each firm. These typically track how each key variable (equity, various types of costs, etc.) has trended and impacted the company’s score year by year. For our top 3, here’s a summary:
• Monolithic Power Systems (MPWR): Strengths: Very high equity ratio and consistent profitability and significantly high net income, increasing 363% ECR points. Monolithic has low debt and retains earnings to fund growth, which means nearly all its assets are backed by equity. Its profit margins are healthy year-over-year, contributing positively to ECR. Weaknesses: It’s hard to find significant weaknesses for Monolithic in 2025, but if any, perhaps its growth investments (acquisitions or R&D) temporarily use up cash – yet even these haven’t dented its stellar ratio. Over time, Monolithic’s one challenge was scaling up – earlier in the decade it was smaller and had a moderate rank, but it turned that into a strength as it grew equity alongside assets. Its strengths-over-time plot shows green bars for equity and income in recent years, reflecting continuous improvement.
• NVE Corp: Strengths: Extremely low liabilities (virtually zero debt) and solid, if not spectacular, steady profits. NVE has a very niche business (spintronics and sensors) and it remains disciplined in spending. It has also distributed dividends, but not so much as to erode its equity base. Over time, NVE’s strengths have been remarkably consistent – its equity buffer has always been high, and it avoids the pitfalls of big expenditures. Weaknesses: Being small, one risk is limited diversification – a downturn in its niche could hurt income. However, financially, the model doesn’t penalize it for size directly, only for financial metrics. Historically, NVE’s weakness might have been growth – it doesn’t grow assets or revenue as fast as some peers – but from a financial ratio perspective, that conservatism is actually a strength. Its track record shows almost all positive effects (green) each year, with hardly any red flags.
• Nvidia Corp: Strengths: Sheer earning power. Nvidia’s ability to generate large profits (and cash) is its number one strength – especially evident in 2024, when its net income soared thanks to AI chip demand. It also has substantial assets, and importantly a significant portion of those assets are financed by equity (Nvidia isn’t highly leveraged; it has debt, but also tens of billions in retained earnings on the books). Weaknesses: Nvidia’s Achilles heel in the model is its expense profile – it spends aggressively on R&D and marketing, which are necessary for a tech leader but count as negative factors in the financial strength analysis. Those high costs relative to revenue were a drag in years when revenue growth paused. Additionally, Nvidia has engaged in stock buybacks and dividends, returning a lot of cash to shareholders over time; while that’s great for investors, it means not all profits stay on the balance sheet – this contributed to its equity ratio being a bit lower than the very top firms. Over time, Nvidia’s strengths-versus-weaknesses plot is interesting: a few years ago, weaknesses (like high costs) dominated, keeping it out of the top tier. In 2024, however, the strengths (massive income) far outweighed those costs, turning the overall outlook green. It’s a reminder that a big leap in profit can swiftly cover weaknesses.
These characteristics show that while different paths exist – Monolithic and NVE took a conservative approach, Nvidia a high-growth approach – the model ultimately rewards the outcomes: high equity and high profits relative to assets. Companies that find the right balance climb the rankings, whereas those that overextend (too much debt or spending without commensurate returns) fall behind.
Financial Trends and Notable Movements
The semiconductor industry’s financial health varies widely across companies, and 2025 saw some significant shifts in the rankings. The industry average Economic Capital Ratio is about 240%, meaning the typical U.S. chip company has roughly 2.4 times more economic capital than assets – a solid buffer. But as the top three illustrate, there is huge dispersion around that average. Some firms have ECRs close to zero (usually younger companies still ramping up or those that struggled with losses), while the best reach extraordinary heights. In fact, the distribution of ECRs is highly skewed: a majority of companies have relatively modest ECRs under 100%, but a handful of standouts pull the average upward.
Figure 5 below shows the distribution of financial strengths (ECR values) across the U.S. semiconductor industry. Each bar represents the number of companies falling into a given ECR range, and each feature (financial factor) is noted when it tends to be a major strength for many companies:
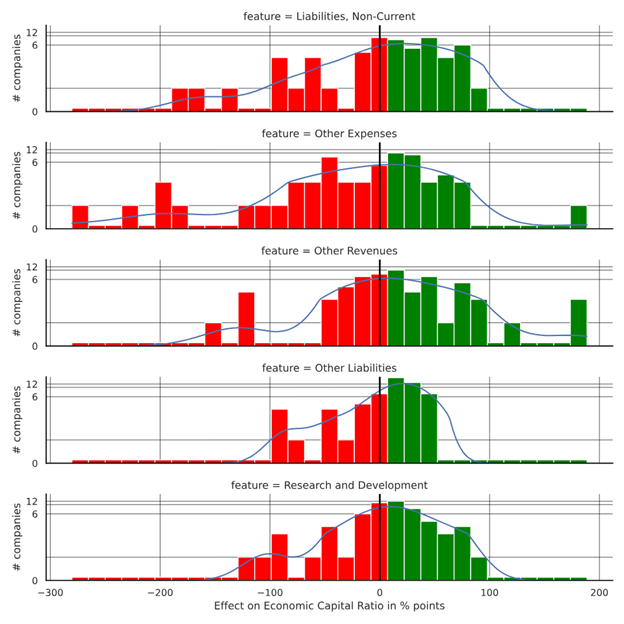
Figure 5: Distribution of financial strength factors among U.S. semiconductor companies. This bar chart illustrates how frequently certain financial features appear as strengths across all firms. The X-axis lists key features (e.g. Equity, Liabilities, Net Income, Expenses), and the Y-axis shows how many companies have that feature as a positive factor. We observe that Stockholders’ Equity and Net Income (profits) are the most common strengths – many semiconductor companies benefit from solid equity bases and good profitability. In contrast, features related to high costs (like large R&D or SG&A expenses) are less frequently strengths (often they are weaknesses), and high liabilities rarely count as a strength (since debt tends to drag down the ECR). This distribution indicates that across the industry, having more equity and income is the prevalent recipe for financial strength, whereas excessive debt or costs are common pitfalls.
Why Do Some Chip Firms Outshine Others? Key Drivers of Financial Strength
What explains these striking differences in financial strength? RealRate’s explainable AI model points to a few key drivers:
• Equity Levels: The proportion of assets funded by equity (stockholders’ equity) is crucial. Companies with higher equity and lower debt consistently outrank others. Equity is essentially the net worth of the company – high equity means owners (shareholders) have put in a lot of capital or retained a lot of earnings, providing a cushion. Low equity (and high liabilities) means heavy borrowing or obligations, which drag down the ECR. In the semiconductor world, firms like Monolithic and NVE keep debt low, which supercharges their ECR. On the other hand, companies that took on significant debt for expansion or stock buybacks see that reflected as a negative on their rating.
• Profitability and Income Generation: The ability to generate strong profits year after year is a major positive effect on ECR. Higher recurring income boosts the economic value of the company. Nvidia is a great example – its recent profit boom sent its financial strength rating soaring. The model considers not just one year’s profit, but a comprehensive measure (including net income and other comprehensive income). Companies that reliably earn more than they spend (high margins) accumulate capital and strengthen their balance sheets, improving their ECR. On the flip side, high costs relative to income are a common weakness. Many semiconductor companies invest heavily in R&D and have significant operating expenses – if those costs aren’t kept in balance with revenue, they weigh down the financial strength. In RealRate’s analysis, R&D and SG&A expenses often appear as red flags (negative effects) in the causal graphs. Firms need to invest to innovate, but the strongest ones manage to do so while still retaining robust profits.
• Asset Base and Efficiency: Interestingly, having more assets can be a double-edged sword in this model. On one hand, growing assets (through expansion, acquisitions, etc.) is normal for a thriving business; but if those assets are funded by debt or don’t generate proportional income, they can dilute the ECR. Thus, asset growth needs to be accompanied by equity growth or income growth to keep ECR high. We saw that in Nvidia’s case – exploding assets (inventory, property, etc.) from its expansion slightly tempered its ECR until earnings caught up. Conversely, companies that maintain lean, efficient asset bases relative to their equity (or whose asset growth is funded mainly by retained earnings) tend to score better.
The RealRate model quantifies the importance of each of these factors. Below is a chart highlighting the relative importance of different financial features for the semiconductor industry’s rating model:
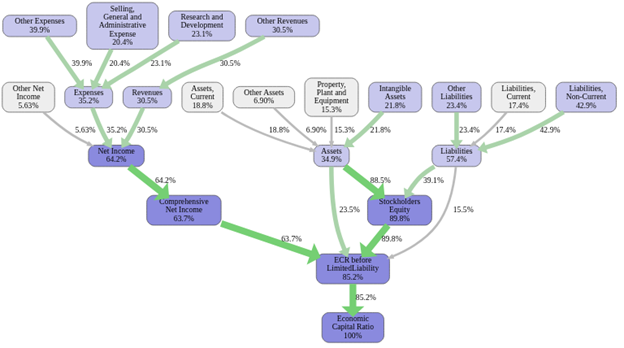
Figure 6: Feature Importance in the financial strength model for U.S. Semiconductors.
This bar chart ranks the model’s input factors by how much they influence the Economic Capital Ratio outcome. Reading it left to right, we see that Stockholders’ Equity (the company’s capital base) is the most influential factor, underscoring that a strong equity position is critical. Next in importance is Liabilities (total debt obligations), which have a strong inverse effect – more liabilities greatly reduce the ECR, so it’s a key factor in the model. Net Income (profitability) and related earnings measures are also high on the list, reflecting that better profits significantly boost financial strength. Lesser factors include specific expense or asset categories (with shorter bars), indicating they have a more minor impact. In summary, the model is driven chiefly by capital structure (equity vs. debt) and profitability.
Big Picture: The U.S. Semiconductor Financial Landscape
The U.S. semiconductor industry is financially solid on average, but the range from weakest to strongest is vast. As of 2025, about a quarter of U.S. chip companies are “Top Rated” by RealRate (14 out of 56 firms analyzed earned that distinction), meaning they significantly exceed the industry average ECR. These top-rated firms tend to be either niche players with focused, profitable businesses or larger companies that have managed to keep a fortress-like balance sheet.
In contrast, companies at the lower end of the ranking often are younger companies investing heavily in future growth (and thus carrying high costs or debt), or occasionally older ones that have hit a rough patch of losses. It’s important to note that a low rank isn’t necessarily a doom sentence – it might simply reflect a strategic decision to invest in growth at the expense of short-term capital ratios. For instance, a startup chip designer might rank low now due to thin equity and big R&D expenses, but a breakthrough product could boost its profits and ranking in a few years. The volatile nature of the semiconductor market – with cycles of boom and bust – means we do see a lot of movement in these financial rankings year to year. Nvidia’s meteoric rise this year is a case in point, and other firms could follow in its footsteps if new technologies (like quantum computing or advanced packaging) pay off.
Finally, it’s worth highlighting the resilience of the industry as shown by these financial metrics. Even after navigating supply chain disruptions and cyclical downturns, many U.S. semiconductor firms have come out with stronger balance sheets. The average Economic Capital Ratio of ~240% signifies that, in aggregate, the industry holds substantial capital buffers. This bodes well for the ability of U.S. chipmakers to weather future storms – whether economic recessions or rapid technology shifts. Companies like Monolithic Power Systems and NVE Corp exemplify prudence and strength, while the rise of Nvidia shows the payoff of innovation reflected in financial health.
In summary, the 2025 RealRate rankings tell a fascinating story: smaller, well-managed firms can outrank even tech titans in financial strength, giants can rapidly improve their footing with blockbuster profits, and across the board, those who keep debt low and equity high come out on top. As the semiconductor industry continues to evolve, we’ll be watching how these financial dynamics play out – which companies leverage their strengths, address their weaknesses, and climb the ladder of economic robustness in the years ahead.