Introduction
The U.S. construction industry generates over $2 trillion in annual revenue, encompassing residential homebuilders, commercial contractors, infrastructure specialists, and specialty service providers. It is an industry defined by cyclical demand, interest rate sensitivity, and capital-intensive project execution — making balance sheet strength an essential buffer against downturns.
RealRate’s 2026 rankings use the Economic Capital Ratio (ECR) to measure true financial resilience. Based on audited balance sheet data for fiscal year 2025, the ECR divides a company’s economic value by its total assets — enabling fair comparisons across vastly different company sizes. The 2026 market average ECR for the U.S. construction sector stands at 146%, reflecting a generally healthy but increasingly concentrated industry. The ranking covers 39 companies tracked over balance sheet years 2010–2025.
2026 Rankings at a Glance
NVR Inc leads the industry with an extraordinary ECR of 625% — 479 percentage points above the market average and more than four times the sector benchmark. PulteGroup secured second place at 373%, while Dream Finders Homes Inc follows at third with 325%. Nine companies achieved Top-Rated status in 2026, down from ten in 2025 and eleven in 2024 — reflecting a tightening financial elite at the top of the industry.
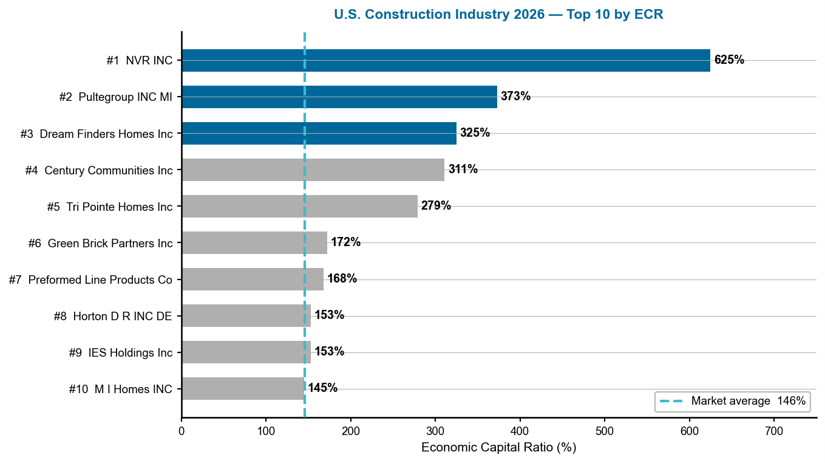
Figure 1 — US Construction Industry 2026: Top 10 companies by ECR. Dashed line = 146% market average
Reading this chart: The horizontal bars show each company’s ECR; longer bars mean greater financial strength. The dashed line is the market benchmark at 146%. NVR’s 625% bar dwarfs the field — its asset-light homebuilding model generates outsized economic value relative to its asset base. The top three companies all exceed 300%, while positions four through nine cluster between 150% and 311%. The gap between the top-rated group and the rest illustrates how balance sheet structure — not revenue size — determines capital resilience in construction.
A Multi-Year Story
NVR Inc has dominated the top rank throughout the analysis period, with its ECR rising from 482% in marketing year 2022 to 625% in 2026 — interrupted only by a dip to 528% in 2024. PulteGroup has been a steady second-tier performer, fluctuating between 336% and 391% over five years. The most dramatic story belongs to Dream Finders Homes, which tripled its ECR from 122% in 2024 to 371% in 2025, then settled to 325% in 2026. The market average has been remarkably stable, hovering between 137% and 148% across the period.
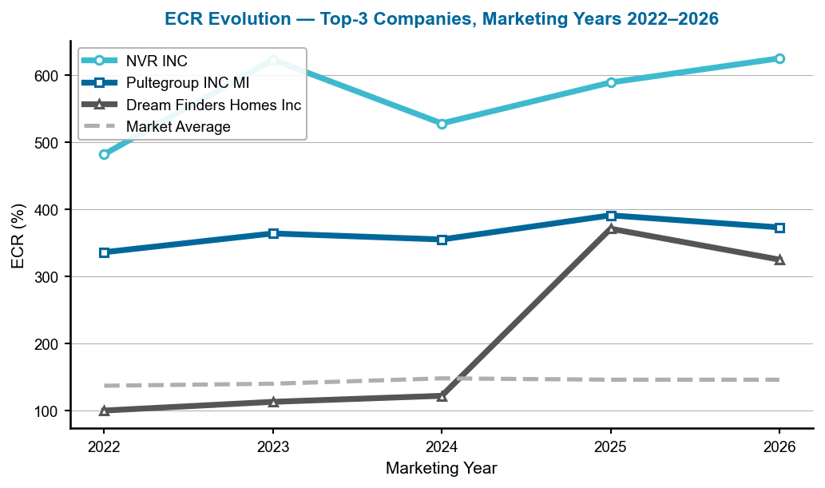
Figure 2 — ECR evolution of the top-3 companies, marketing years 2022–2026.
Reading this chart: Each line traces a company’s ECR across marketing years — rising lines signal improving capital strength. The dashed grey line is the market average. NVR’s trajectory shows dominant and growing strength, while PulteGroup maintains a stable band. Dream Finders Homes’ vertical leap from 122% to 371% in a single year is the most dramatic movement in the dataset — driven by a structural improvement in profitability and balance sheet composition.
Company Profiles
1. NVR Inc — The Asset-Light Homebuilder at the Summit
NVR Inc operates under the Ryan Homes, NVHomes, and Heartland Homes brands, building single-family homes across the eastern United States. Unlike most homebuilders, NVR uses an asset-light lot option strategy — purchasing finished lots from developers rather than holding raw land on its balance sheet. This capital-efficient approach has made NVR the undisputed leader in financial resilience among U.S. construction companies.
NVR’s greatest ECR driver is net income, contributing an extraordinary 471 percentage points above the industry average — reflecting the company’s ability to generate outsized profits relative to its asset base. Revenues add 274 points and operating expenses contribute 226 points. The main drag is other assets at −586 points, reflecting the complex asset structures created by the lot option model. Despite this, the net result is an ECR of 625%, placing NVR 479 points above the market average — a position of overwhelming financial dominance in the sector.
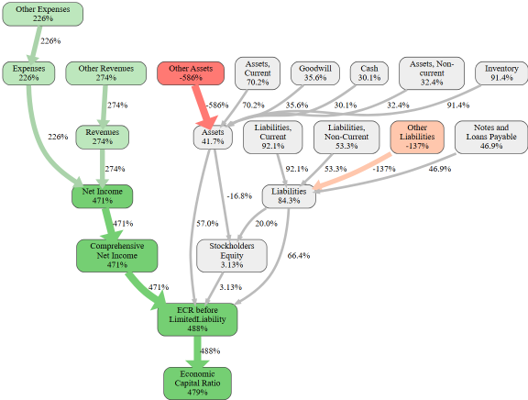
Figure 3 — NVR Inc: causal ECR graph. Each node shows the effect (in ECR %-points) of that variable relative to the industry average. Green paths boost ECR; red paths reduce it.
This causal graph reveals NVR’s financial architecture. Net Income at +471 pp is the overwhelming positive node — NVR’s profitability relative to assets is unmatched in the sector. Revenues at +274 pp and Expenses at +226 pp confirm the efficient operating model. Other Assets at −586 pp is the largest negative node, but this structural drag is more than offset by the income drivers. The final Economic Capital Ratio node shows +479 pp above market average.
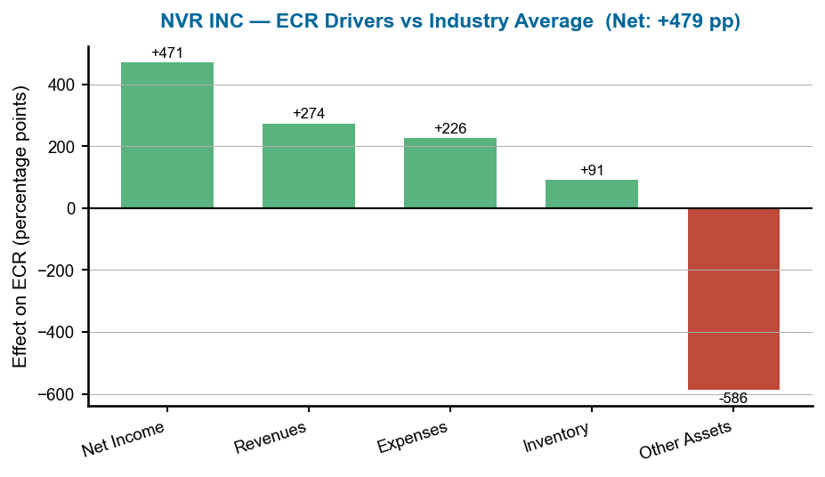
Figure 4 — NVR Inc: ECR drivers versus industry average. Each bar shows a variable’s effect on ECR in percentage points; green = positive, red = negative.
2. PulteGroup — The Balanced Builder
PulteGroup operates under the Pulte Homes, Del Webb, and Centex brands, serving first-time, move-up, and active adult buyers across more than 40 U.S. markets. The company has maintained a consistently strong financial position, with its ECR fluctuating between 336% and 391% over the past five marketing years.
PulteGroup’s greatest ECR driver is net income at +219 percentage points, followed by operating expenses at +132 and revenues at +110. Stockholders’ equity contributes +37 points, reflecting a solid equity base. The main weakness is inventory at −125 points — a structural feature of large homebuilders who carry significant land and homes-in-progress on their balance sheets. With an ECR of 373%, PulteGroup sits 227 points above the market average, demonstrating the financial resilience that comes from combining strong profitability with a diversified brand portfolio.
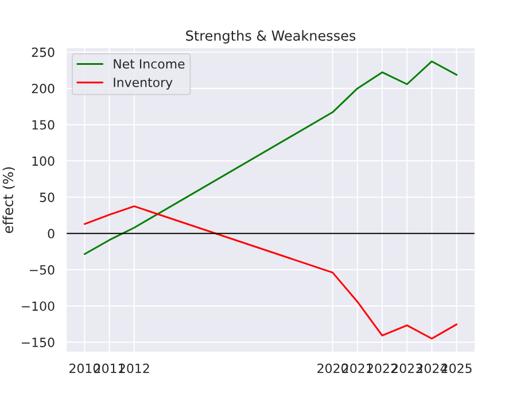
Figure 5 — PulteGroup: ECR strengths and weaknesses over time.
PulteGroup’s strengths-and-weaknesses chart shows remarkable consistency. The positive contributions from income and revenue have grown steadily since 2020, while the inventory drag has remained relatively stable. This balance between growth in positive drivers and containment of structural weaknesses explains PulteGroup’s sustained position near the top of the rankings.
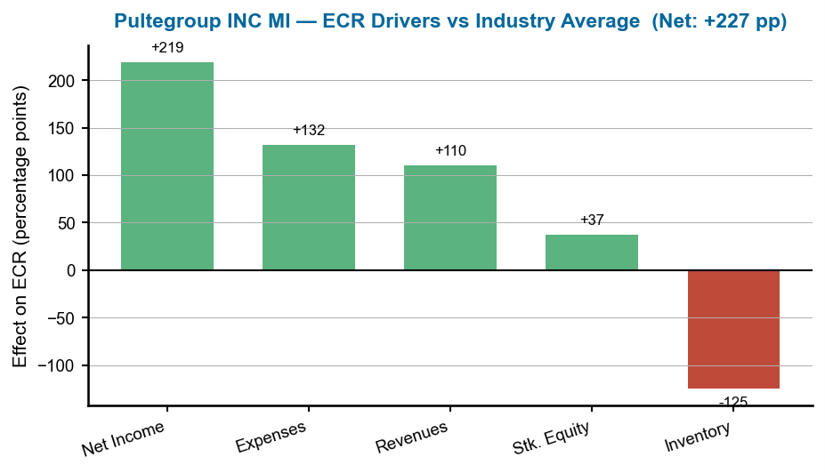
Figure 6 — PulteGroup: ECR drivers versus industry average.
3. Dream Finders Homes — The Rising Contender
Dream Finders Homes is a Jacksonville-based homebuilder focused on entry-level and first-time move-up buyers in high-growth Southeastern and Mid-Atlantic markets. The company entered the RealRate ranking in 2022 with a modest ECR of 100%, then tripled its score to 371% by 2025 before settling to 325% in 2026 — one of the most remarkable financial transformations in the dataset.
Dream Finders’ greatest ECR driver is net income at +203 percentage points, followed by expenses at +125 and revenues at +104. The main weakness is other liabilities at −112 points, reflecting the financing structures used to fund rapid growth. Inventory drags at −32 points. With an ECR of 325% — 179 points above the market average — Dream Finders demonstrates that fast-growing small and mid-cap homebuilders can achieve capital strength comparable to industry veterans when profitability improves structurally.
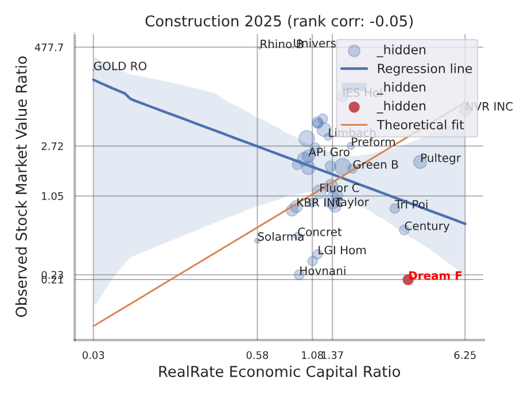
Figure 7 — Dream Finders Homes: backtesting correlation — RealRate ECR vs. observed market value ratio (red dot marks Dream Finders’ position).
This company-specific scatter plot — identified by the red dot marking Dream Finders’ position — shows how well the ECR model predicted the company’s actual market performance. As a relatively new entrant with rapid ECR growth, Dream Finders’ position relative to the regression line indicates whether the market has fully priced in its improving financial fundamentals.
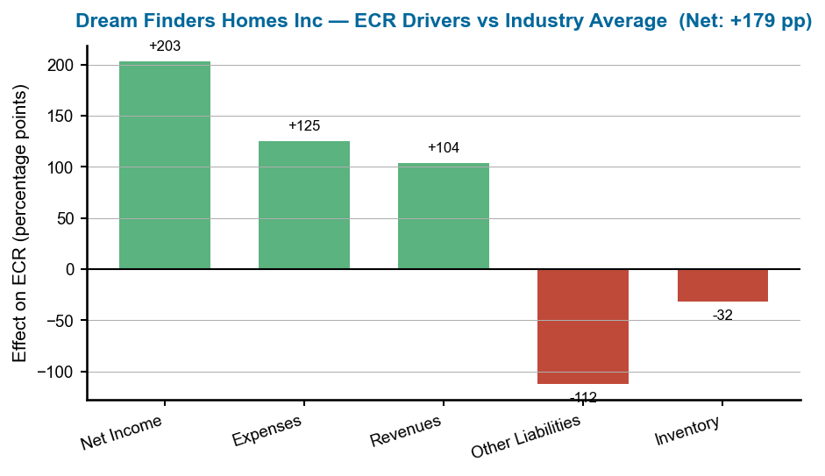
Figure 8 — Dream Finders Homes: ECR drivers versus industry average.
What Drives Financial Strength in Construction?
RealRate’s model identifies net income, comprehensive net income, and operating expenses as the three most influential variables for ECR in U.S. construction. Inventory — the defining balance sheet item for homebuilders — ranks among the most impactful variables, acting as a significant drag for companies carrying large land banks. Liability structure plays a critical role, with companies maintaining lower leverage consistently outperforming those relying on debt-funded growth. The message is clear: in construction, profitability efficiency and capital discipline determine long-term financial resilience.
Figure 9 — US Construction Industry: feature importance for ECR prediction (industry-level).
This feature importance chart shows which financial variables most influence ECR predictions across all construction companies. Profitability metrics dominate the top of the ranking, confirming that the sector rewards companies with efficient capital conversion. Inventory’s high importance reflects the fundamental trade-off in homebuilding: land and work-in-progress inventory are necessary for operations but create structural ECR drag.
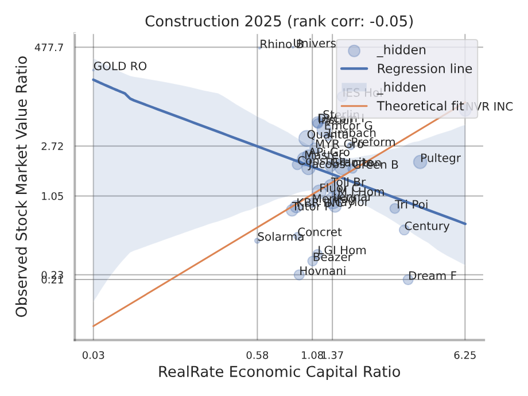
Figure 10 — US Construction Industry: backtesting correlation — RealRate ECR vs observed market value ratio (industry-level, no red company dot).
Market Statistics
The average ECR across the 39 U.S. construction companies in 2026 is 146% — essentially unchanged from 2025 and down just 2 percentage points from the 2024 peak of 148%. The multi-year stability is notable: the market average has held between 137% and 148% since 2022, suggesting a structurally healthy sector. However, the number of Top-Rated companies has steadily declined — from 11 in 2024 to 10 in 2025 to just 9 in 2026 — indicating that financial strength is concentrating at the top of the industry.
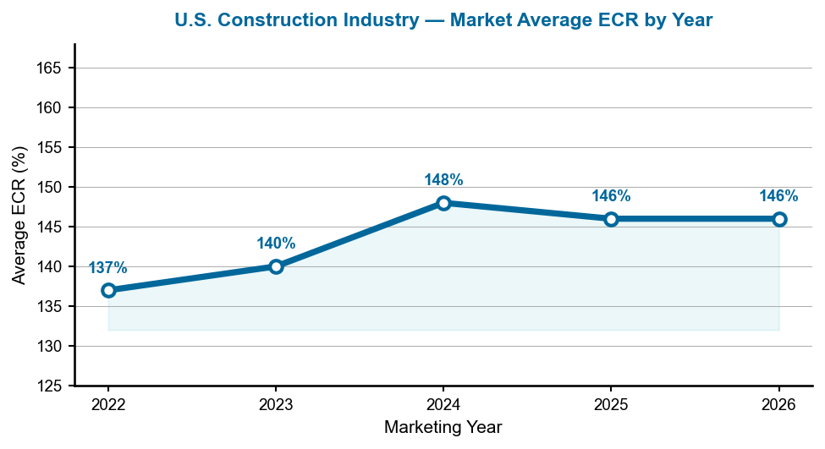
Figure 11 — Average ECR for the US construction industry, marketing years 2022–2026.
This line chart traces the market average ECR from 2022 to 2026. The gradual rise from 137% to a peak of 148% in 2024 reflected post-pandemic housing demand and improved margins across the sector. The slight retreat to 146% in 2025–2026 suggests the industry has reached a new equilibrium — structurally stronger than pre-pandemic levels but no longer accelerating.
Notable Movers
The most dramatic movement in 2026 belongs to Sekisui House U.S., which collapsed from an ECR of 340% and fifth place in 2025 to just 102% and 28th place — a staggering 238 percentage point decline and the loss of Top-Rated status. Fluor Corp similarly fell from 176% to 117%, dropping from eighth to 18th and losing its Top-Rated designation. On the upside, Kingfish Holding nearly doubled its ECR from 59% to 107%, while MYR Group recovered from 98% to 112%. IES Holdings climbed into the Top-Rated group at ninth place with an ECR of 153%, rewarded for steady improvement in capital efficiency.
Manager’s Takeaway
The 2026 U.S. construction rankings deliver a clear message: asset-light models and profitability discipline create durable financial strength. NVR’s lot option strategy — avoiding the inventory drag that weighs on traditional homebuilders — produces an ECR of 625%, more than four times the market average. PulteGroup at 373% proves that even inventory-heavy builders can achieve strong capital positions when profitability is consistently high. And Dream Finders’ leap from 122% to 325% in just two years demonstrates that structural improvements in profitability can rapidly transform a company’s financial standing. For investors and risk managers, the RealRate ECR offers a clear signal: in construction, net income efficiency and balance sheet discipline matter far more than revenue scale.