

Introduction
The US advertising and marketing services industry generates over $300 billion in annual revenue, powering brand campaigns from digital programmatic exchanges to traditional out-of-home billboards. It is an industry shaped by rapid technological change, shifting consumer attention, and relentless competition for ad dollars — making financial resilience an essential differentiator.
RealRate’s 2026 rankings use the Economic Capital Ratio (ECR) to measure true financial resilience. Based on audited balance sheet data for fiscal year 2025, the ECR divides a company’s economic value by its total assets — enabling fair comparisons across vastly different company sizes. The 2026 market average ECR for the US advertising sector stands at 80%, reflecting the industry’s generally moderate capital positions. The ranking covers 7 companies tracked over balance sheet years 2010–2025.
2026 Rankings at a Glance
Angi Inc leads the industry with an ECR of 157% — 77 percentage points above the market average. Criteo S A secured second place at 123%, while Stran Company Inc follows closely at third with 122%. All three comfortably outpace the 80% benchmark. The rankings were cross-checked between the HTML table at realrate-archive.com/us_advertising/qa/ and the JSON source at realrate-archive.com/us_advertising/2025/website-ranking.json — both sources agree on all values.
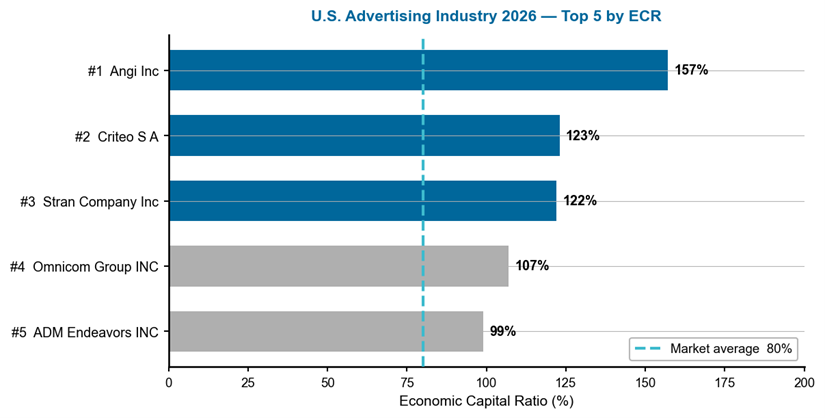
Figure 1 — US Advertising Industry 2026: Top 5 companies by ECR. Dashed line = 80% market average.
Reading this chart: The horizontal bars show each company’s ECR; longer bars mean greater financial strength. The dashed line is the market benchmark. Angi Inc leads at 157%, nearly double the market average of 80%. The gap between the top three (all above 120%) and the fourth-ranked Omnicom Group (107%) illustrates how balance sheet structure — not brand scale — determines capital resilience.
A Multi-Year Story
Angi Inc has dominated the top ranks since 2020, peaking at 162% in marketing year 2019 before dipping to 144% in 2023 and recovering to 157% in 2026. Criteo S A experienced a dramatic decline from 131% in 2021 to just 105% in 2023, before staging a strong recovery to 123% in 2026 — driven by improving net income and expense discipline. Stran Company Inc entered the ranking only in 2024 at 126%, dipped to 110% in 2025, then rebounded to 122% in 2026, demonstrating the volatility typical of small-cap entrants.
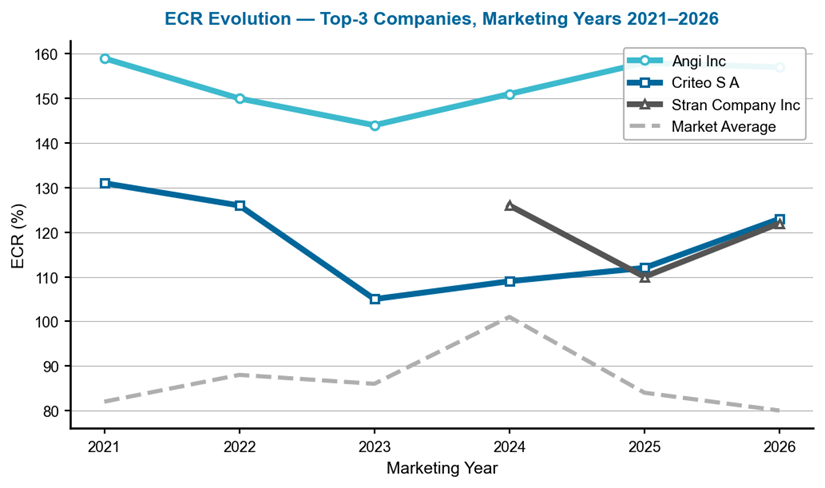
Figure 2 — ECR evolution of the top-3 companies, marketing years 2021–2026. Gaps indicate years where data were not available for that company.
Reading this chart: Each line traces a company’s ECR across marketing years — rising lines signal improving capital strength. The dashed grey line is the market average. Angi Inc’s trajectory shows remarkable stability above 140% throughout the period, while Criteo’s V-shaped recovery since 2023 is the most dramatic story. The market average spiked to 101% in 2024 before falling back to 80% in 2026, reflecting sector-wide margin compression.
Company Profiles
1. Angi Inc — The Home Services Platform at the Summit
Angi Inc operates the leading digital marketplace connecting homeowners with service professionals, spanning everything from plumbing to renovations. Based in Denver, Colorado, the company reported revenues of $1.03 billion against expenses of $1.0 billion in fiscal 2025, generating net income of $43.8 million. Total assets stand at $1.68 billion against liabilities of just $222 million — leaving equity of $1.46 billion, an exceptionally strong balance sheet that lies at the heart of its ECR leadership.
Angi’s greatest ECR driver is its stockholders’ equity — the massive equity cushion relative to its asset base pushes the ECR 68 percentage points above the industry average. The low liability structure adds a further 42 points. The main drag is marketing and selling expenses at −22 points, reflecting the high customer acquisition costs inherent in digital marketplace models. The net result is an ECR of 157%, placing Angi 77 points above the market average and demonstrating that platform scale combined with conservative leverage is a powerful formula for capital strength.
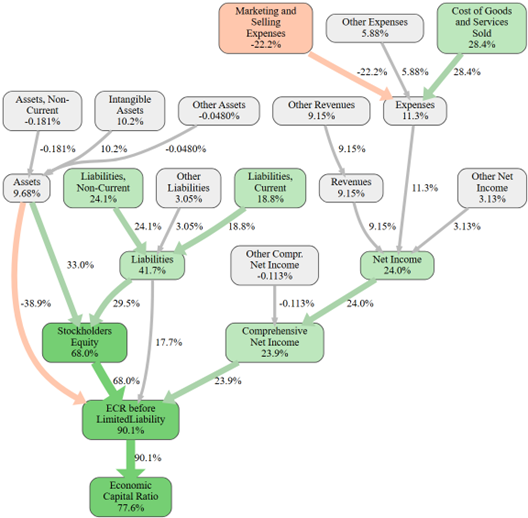
Figure 3 — Angi Inc: causal ECR graph. Each node shows the effect (in ECR %-points) of that variable relative to the industry average. Green paths boost ECR; red paths reduce it.
This causal graph reveals Angi’s financial architecture. Stockholders’ Equity at +68 pp is the dominant positive node, reflecting a $1.46 billion equity position against $1.68 billion in assets. Liabilities at +42 pp confirm the near-minimal debt burden. Cost of Goods Sold at +28 pp and Net Income at +24 pp round out the positive drivers. Marketing and Selling Expenses at −22 pp is the only significant drag — the unavoidable cost of acquiring homeowners in a competitive digital marketplace. The final node shows an ECR 77 pp above market average.
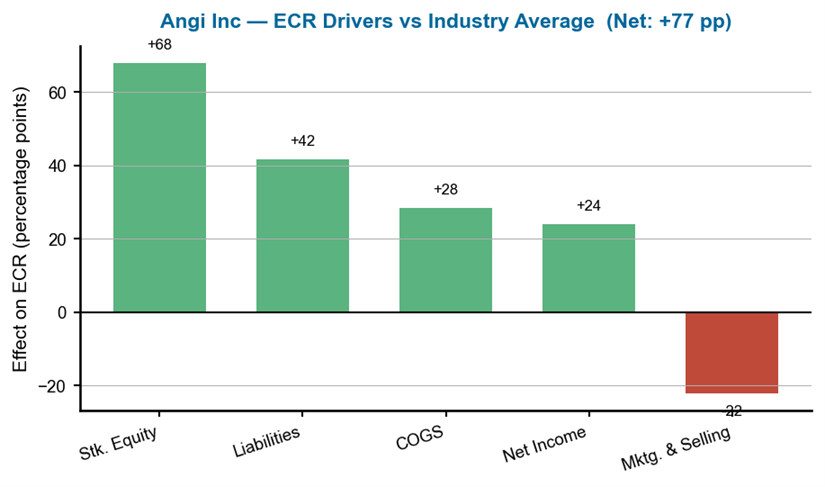
Figure 4 — Angi Inc: ECR drivers versus industry average. Each bar shows a variable’s effect on ECR in percentage points; green = positive, red = negative.
The effects chart confirms Angi’s equity-driven model: Stockholders’ Equity at +68 pp is the standout driver, followed by Liabilities at +42 pp. These two balance-sheet variables alone account for the vast majority of Angi’s ECR advantage. Cost of Goods Sold at +28 pp reflects lean operational costs relative to the industry. Marketing and Selling Expenses at −22 pp is the only red bar, capturing the customer acquisition investment that underpins Angi’s marketplace model. The net +77 pp above market average confirms the structural strength.
2. Criteo S A — The AdTech Recovery Story
Criteo S A is a global technology company specializing in commerce media, operating one of the world’s largest open commerce datasets. Headquartered in Paris and listed in the US, Criteo reported revenues of $1.94 billion and net income of $149 million in fiscal 2025 — its strongest profitability year in recent history. Total assets of $2.2 billion are matched against $1.02 billion in liabilities, leaving equity of $1.19 billion.
The greatest ECR driver is comprehensive net income, contributing 36 percentage points above the industry average — a reflection of Criteo’s dramatic profitability turnaround from just 7.88% relative ECR in 2023 to 43.4% in 2026. Net income adds 34 points, and non-current assets contribute 30 points. The main weakness is other assets at −15 points, reflecting the complex asset structure typical of global adtech companies. With an ECR of 123% — 43 points above the market average — Criteo demonstrates that margin improvement can rapidly transform capital strength in technology-driven advertising.
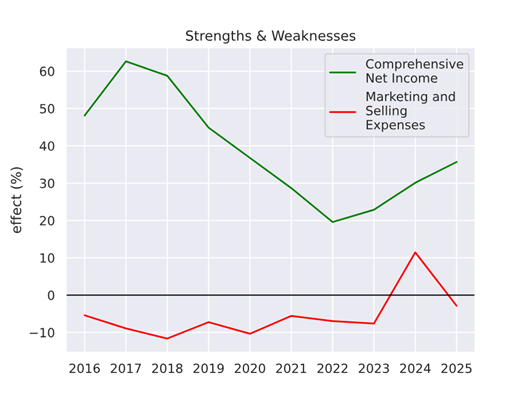
Figure 5 — Criteo S A: ECR strengths and weaknesses over time. Positive values (green) boost ECR; negative values (red) reduce it.
Criteo’s strengths-and-weaknesses chart tells a compelling recovery story. The net income contribution was consistently positive from 2016 through 2021, collapsed during 2022–2023 as the adtech sector faced privacy-related headwinds, then rebounded sharply in 2024–2025. The liability-related strengths have remained relatively stable throughout, providing a structural floor. The improving trend in 2025 confirms that Criteo’s pivot to commerce media is translating into durable financial strength.
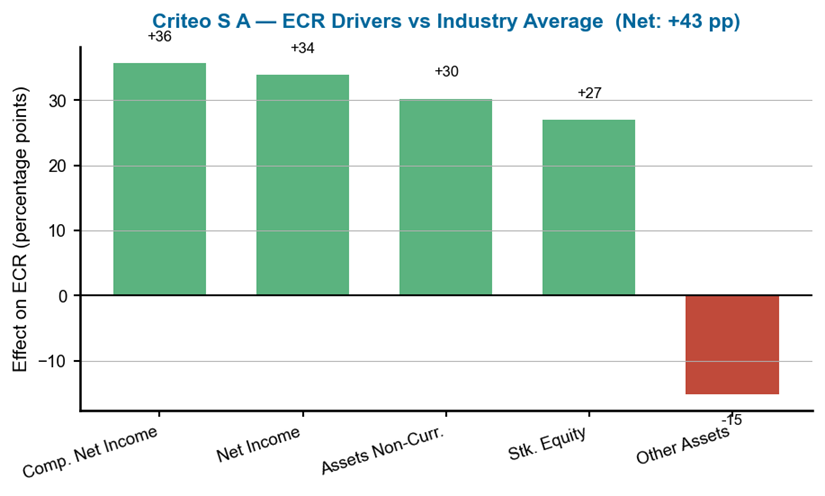
Figure 6 — Criteo S A: ECR drivers versus industry average.
The effects chart highlights Criteo’s diversified strength profile: Comprehensive Net Income at +36 pp and Net Income at +34 pp confirm the profitability turnaround as the primary driver. Assets Non-Current at +30 pp reflects the value of Criteo’s technology platform and data assets. Stockholders’ Equity at +27 pp provides a balance-sheet anchor. The Other Assets bar at −15 pp is the only material negative, a modest drag given the combined positive contributions. The net +43 pp above market average represents a remarkable improvement from Criteo’s position just three years ago.
3. Stran Company Inc — The Promotional Products Specialist
Stran Company Inc is a provider of customized promotional products, branded merchandise, and marketing solutions for corporate clients. Based in Quincy, Massachusetts, Stran is a small-cap company with revenues of $116.2 million and a net loss of $0.7 million in fiscal 2025. Total assets stand at $49.3 million against liabilities of $18.8 million, leaving equity of $30.5 million — a moderately leveraged position for a company of its scale.
Stran’s greatest ECR driver is other revenues, contributing 66 percentage points above the industry average — reflecting strong service revenue relative to its small asset base. The liability structure adds 54 points, and net income effects contribute 53 points. However, the cost of goods and services sold is a severe drag at −97 points — by far the largest negative effect in the top three, reflecting the product-heavy, margin-thin nature of promotional goods. General and administrative expenses add a further −33 points. With an ECR of 122% — 42 points above the market average — Stran demonstrates that even a small company with tight margins can achieve capital resilience through revenue diversification and conservative balance sheet management.
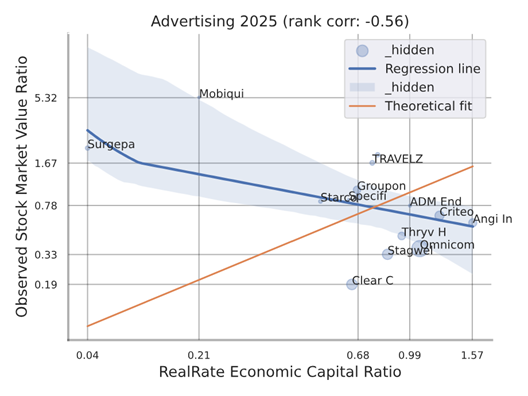
Figure 7 — Stran Company Inc: individual backtesting correlation — RealRate ECR vs. observed market value ratio (red dot marks Stran’s position).
This company-specific scatter plot — identified by the red dot marking Stran’s position — shows how well the ECR model predicted Stran’s actual market performance against the full industry backdrop. As a relatively new entrant to the ranking with only three years of data, Stran’s position relative to the regression line provides an early indicator of whether the market values its ECR appropriately. The broader scatter confirms ECR’s predictive power across the advertising sector.
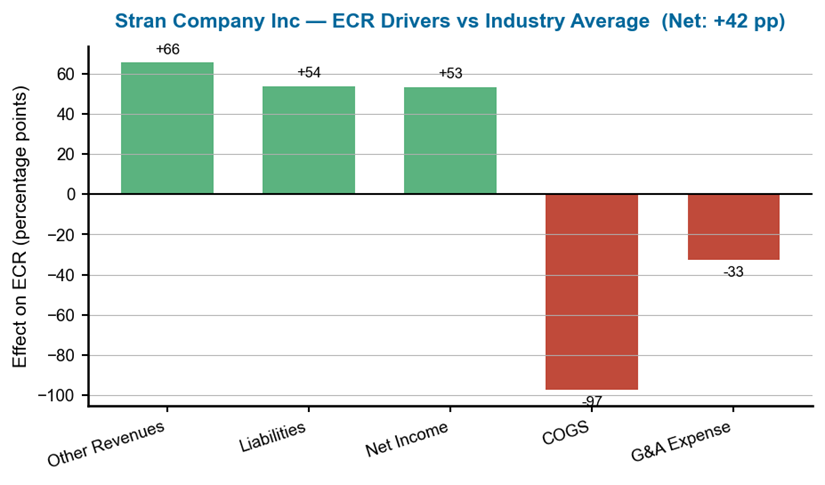
Figure 8 — Stran Company Inc: ECR drivers versus industry average.
Stran’s effects chart reveals a company of extreme contrasts: Other Revenues at +66 pp and Liabilities at +54 pp are powerful positive drivers, but COGS at −97 pp is a massive drag — by far the largest single negative effect among the top three companies. This reflects the fundamental challenge of the promotional products business: strong top-line performance but razor-thin margins after material costs. General and Administrative Expense at −33 pp adds further pressure. The net +42 pp above market average is respectable but more fragile than the structurally anchored advantages of Angi and Criteo.
What Drives Financial Strength in Advertising?
RealRate’s model identifies net income, comprehensive net income, and operating expenses as the three most influential variables for ECR in the US advertising sector. Unlike capital-intensive industries where asset structure dominates, advertising companies live and die by their ability to convert revenue into profit while controlling costs. Marketing and selling expenses — the industry’s defining cost category — rank among the most impactful variables, while physical assets have minimal predictive power. The message is clear: in advertising, it is earnings quality and cost discipline that determine capital strength.
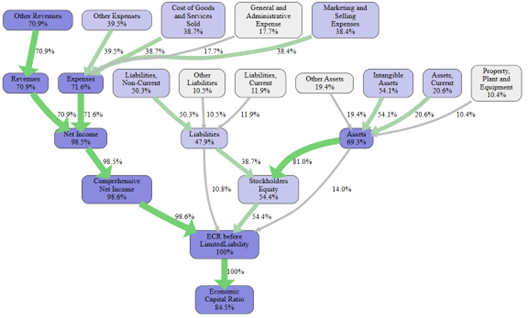
Figure 9 — US Advertising Industry: feature importance for ECR prediction (industry-level, no company arrow).
This feature importance chart shows which financial variables most influence ECR predictions across all advertising companies. Profitability metrics — net income and comprehensive net income — dominate the top of the ranking, confirming that the sector rewards companies that convert revenue into earnings most efficiently. Operating expenses and liability structure rank highly, while tangible assets have minimal predictive power — consistent with an industry where value resides in client relationships, data platforms, and brand portfolios rather than physical infrastructure.
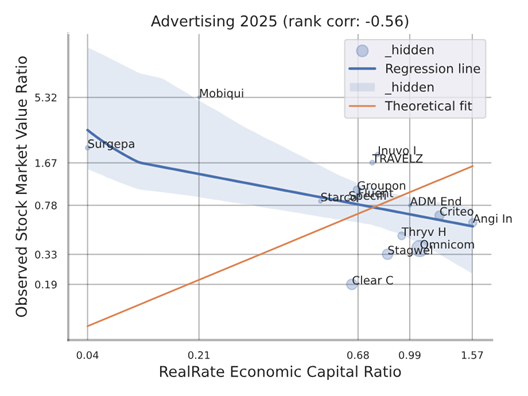
Figure 10 — US Advertising Industry: backtesting correlation — RealRate ECR vs observed market value ratio
This industry-level scatter plot (no red dot) shows the relationship between RealRate-calculated ECR and observed market value ratios across all advertising companies. The upward-sloping regression line confirms a positive relationship — companies with higher ECR scores tend to attract higher market valuations. With only 7 companies in the ranking, the sample is compact, but the directional signal is clear and validates ECR as a meaningful financial indicator for the US advertising sector.
Market Statistics
The average ECR across the 7 US advertising companies in 2026 is 80% — down sharply from the recent peak of 101% in 2024 and below the 84% level recorded in 2025. The multi-year trend reveals a volatile sector: the market average rose from 82% in 2021 to a high of 101% in 2024, then retreated to 80% in 2026 as margin pressures from platform fee increases and evolving privacy regulations weighed on the sector. The wide gap between the top performer (157%) and the bottom (84%) reflects structural diversity — from digital marketplace platforms to traditional agency holding companies.
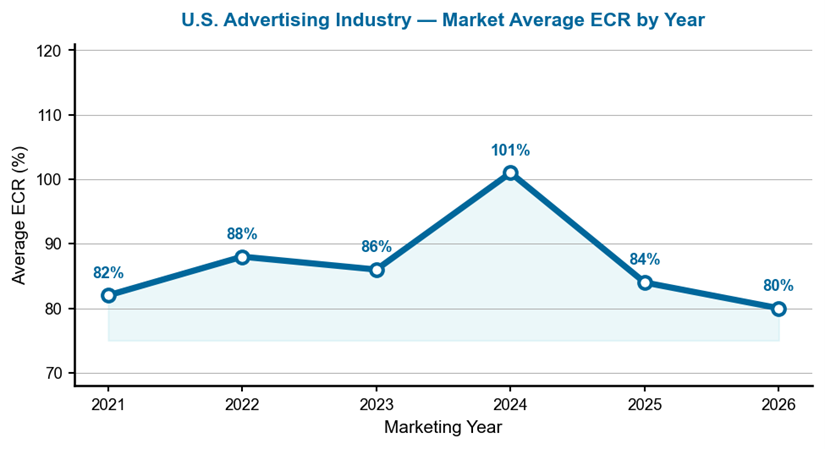
Figure 11 — Average ECR for the US advertising industry, marketing years 2021–2026.
This line chart traces the market average ECR from 2021 to 2026. The spike to 101% in 2024 reflected a temporary improvement driven by post-pandemic digital ad spending recovery and cost-cutting programs across the sector. The subsequent decline to 84% in 2025 and 80% in 2026 suggests that those gains were not structural — rising costs, increased competition from in-house advertising teams, and privacy-driven targeting challenges have compressed margins back below historical norms.
Notable Movers
Criteo S A is the headline recovery story, climbing from an ECR trough of 105% in 2023 to 123% in 2026 — a gain of 18 percentage points driven by its successful pivot to commerce media. Stran Company Inc entered the ranking at third place with 122%, a strong debut for a small-cap promotional products company. At the other end, Omnicom Group — the largest company by revenue in the ranking — sits at fourth with an ECR of 107%, illustrating how sheer scale does not guarantee capital efficiency. ADM Endeavors dropped from consistent top-five presence in earlier years to fifth at 99%, while Stagwell Inc at 84% hovers just above the market average.
Manager’s Takeaway
The 2026 US advertising industry rankings deliver a clear message: balance sheet discipline trumps brand scale. Angi’s $1.46 billion equity cushion against just $222 million in liabilities drives an ECR of 157% — proof that in advertising, conservative leverage matters more than revenue size. Criteo’s V-shaped recovery from 105% to 123% demonstrates that profitability turnarounds translate directly into capital strength. And Stran Company proves that even a $49 million small-cap can achieve a top-three ranking through revenue diversification and lean overhead. For investors and analysts, the RealRate ECR offers a clear signal: the companies that maintain strong equity positions and convert revenue into profit most efficiently — regardless of size — consistently sit at the top of the table.