Medical Transport, FBO Specialists, and Low-Cost Carriers — RealRate Reveals America’s Financially Strongest Aviation Companies.
Introduction
The U.S. air transportation sector is one of the most capital-intensive and operationally demanding industries in the American economy. From vast legacy carriers operating thousands of daily flights to nimble specialty operators providing air medical transport and fixed-base services, the industry spans a remarkable range of business models — each with a different relationship to capital, leverage, and financial risk.
The U.S. air transportation industry generated approximately $250 billion in combined operating revenues in 2024, with major network carriers and low-cost airlines accounting for the bulk of passenger volume. Despite a strong post-pandemic rebound, the sector continues to face persistent margin pressure from fuel price volatility, intensifying pilot shortages, and substantial fleet modernization demands across the board.
RealRate’s 2026 rankings cut through revenue and passenger figures to assess true financial resilience using the Economic Capital Ratio (ECR). Based on audited balance sheet data for fiscal year 2025, the ECR divides a company’s economic value by its total assets — making comparisons fair across carriers of vastly different scales. The 2026 market average ECR for U.S. air industry companies stands at 69%, with the top performers exceeding it by 15 to 54 percentage points.
2026 Rankings at a Glance
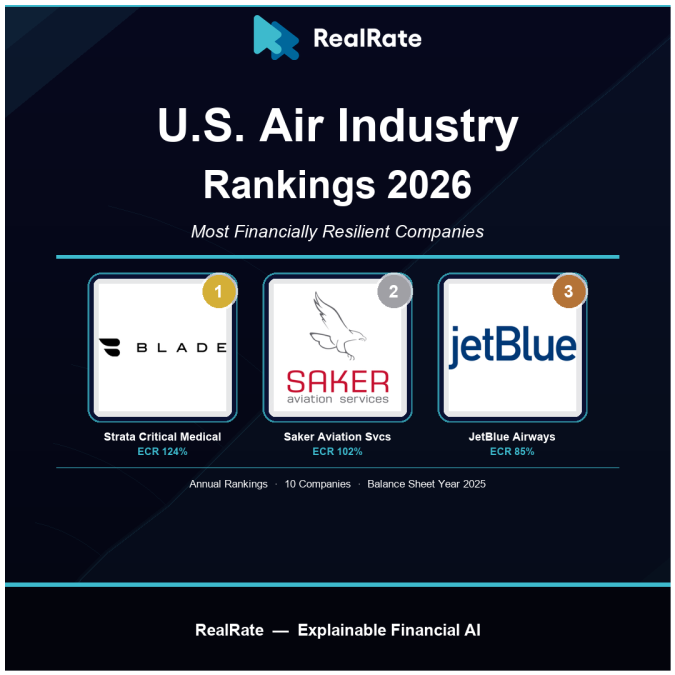
Strata Critical Medical Inc claimed first place with an ECR of 124% — 54 percentage points above the industry average of 69%. Saker Aviation Services Inc ranked second at 102% (+33 pp above average), and JetBlue Airways Corp placed third at 85% (+16 pp). Southwest Airlines Co rounded out the top four at 80%. Notably, the top two positions are held by specialized operators — an air medical services company and a fixed-base operator — rather than traditional scheduled airlines. Rankings were verified by cross-checking the HTML ranking table with the JSON data source; both confirm the values above.
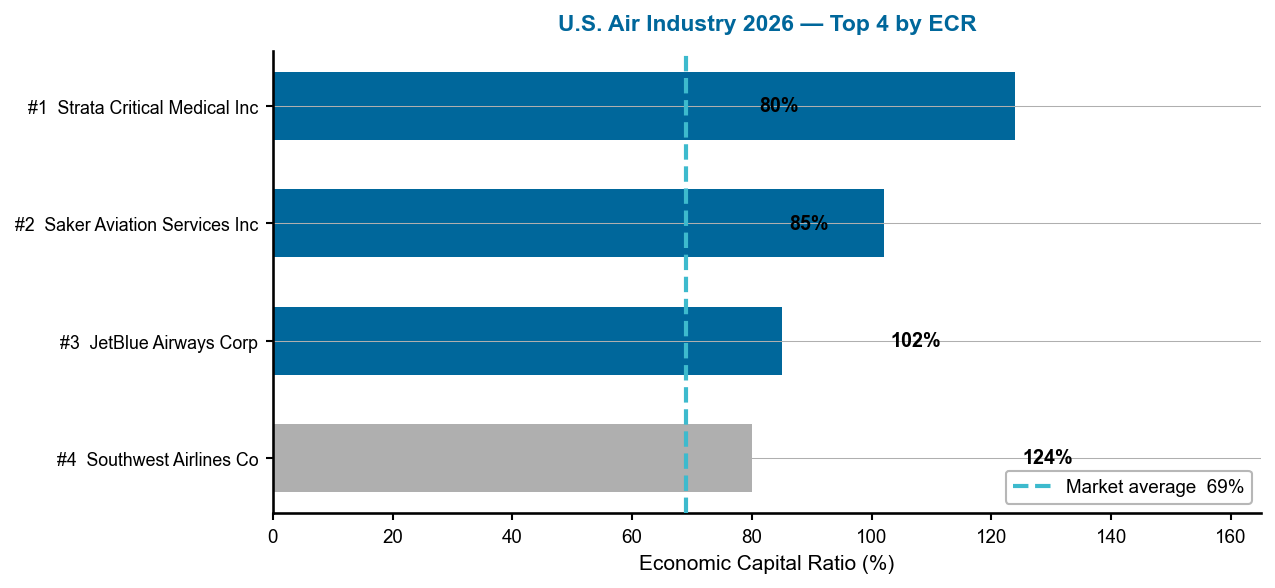
Figure 1 — U.S. Air Industry 2026: Top 4 companies by ECR. Dashed line = 69% market average. Source: RealRate Archive (JSON, 2025).
Reading this chart: Horizontal bars represent each company’s ECR — longer bars signal greater financial resilience. Strata’s bar at 124% towers over the 69% market average, underscoring how radically different its balance sheet is from typical airlines. Saker, also asset-light and equity-rich, holds a commanding second. JetBlue and Southwest show how the largest airlines still outperform the market average, even while carrying the debt loads inherent to their business model.
A Multi-Year Story
The most dramatic storyline of the 2026 rankings is Strata Critical Medical’s surge from rank 2 (ECR 90%) in 2025 to rank 1 (ECR 124%) in 2026 — a 34-percentage-point leap that propelled it past perennial leader Saker Aviation Services. Saker, which had commanded the top spot from 2023 through 2025 with ECR values ranging from 127% to 129%, saw its ECR contract sharply to 102% in 2026 — still well above the market average, but enough to cede the crown. JetBlue has remained consistently above the 85% mark across three consecutive years, making it the most stable performer among the large scheduled airlines, while the market average edged up modestly from a four-year low of 68% in 2025 to 69% in 2026.
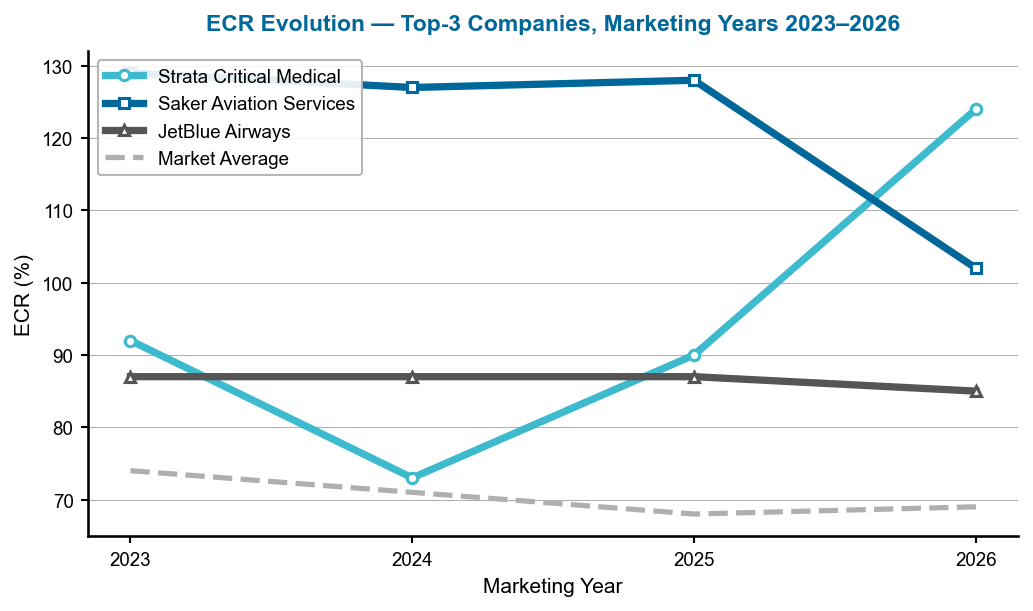
Figure 2 — ECR evolution of the top-3 companies, marketing years 2023–2026. Dashed grey = market average. Source: RealRate Archive.
Reading this chart: Rising lines signal improving capital strength; falling lines signal deterioration. Saker’s line (dark blue) peaked above 129% in 2023 and has trended down steadily since, while Strata’s line (teal) is sharply ascending — crossing Saker’s between 2025 and 2026 to claim the top position. JetBlue (grey) is nearly flat across the four years, reflecting a stable — if not growing — capital structure. The market average (dashed) shows the broad sector hovering in the 68–74% range, well below the top performers.
Company Profiles
1. Strata Critical Medical Inc — Air Medical Services Takes Flight
Strata Critical Medical Inc is a specialized air medical services provider whose business model sits at the intersection of aviation and healthcare. With $197.1 million in 2025 revenues, $41.3 million in net income — a margin of approximately 21% — and total assets of just $325.5 million, the company generates exceptional returns on a compact capital base. Its equity of $279.1 million against liabilities of only $46.4 million gives it an equity-to-asset ratio of 86% — extraordinary for any company, let alone one in the aviation sector.
Strata’s ECR of 124% — 54 percentage points above the market average — is driven by two primary forces: operating expenses significantly lower than the industry norm (+46.5 pp to ECR), and a stockholders’ equity position that far outpaces competitors (+30.8 pp). The dominant drag is Other Expenses (−81.2 pp), reflecting medical-specific cost categories that are high relative to the industry average when measured against assets. Despite this headwind, the company’s balance sheet discipline and operating efficiency carry it comfortably to the summit.
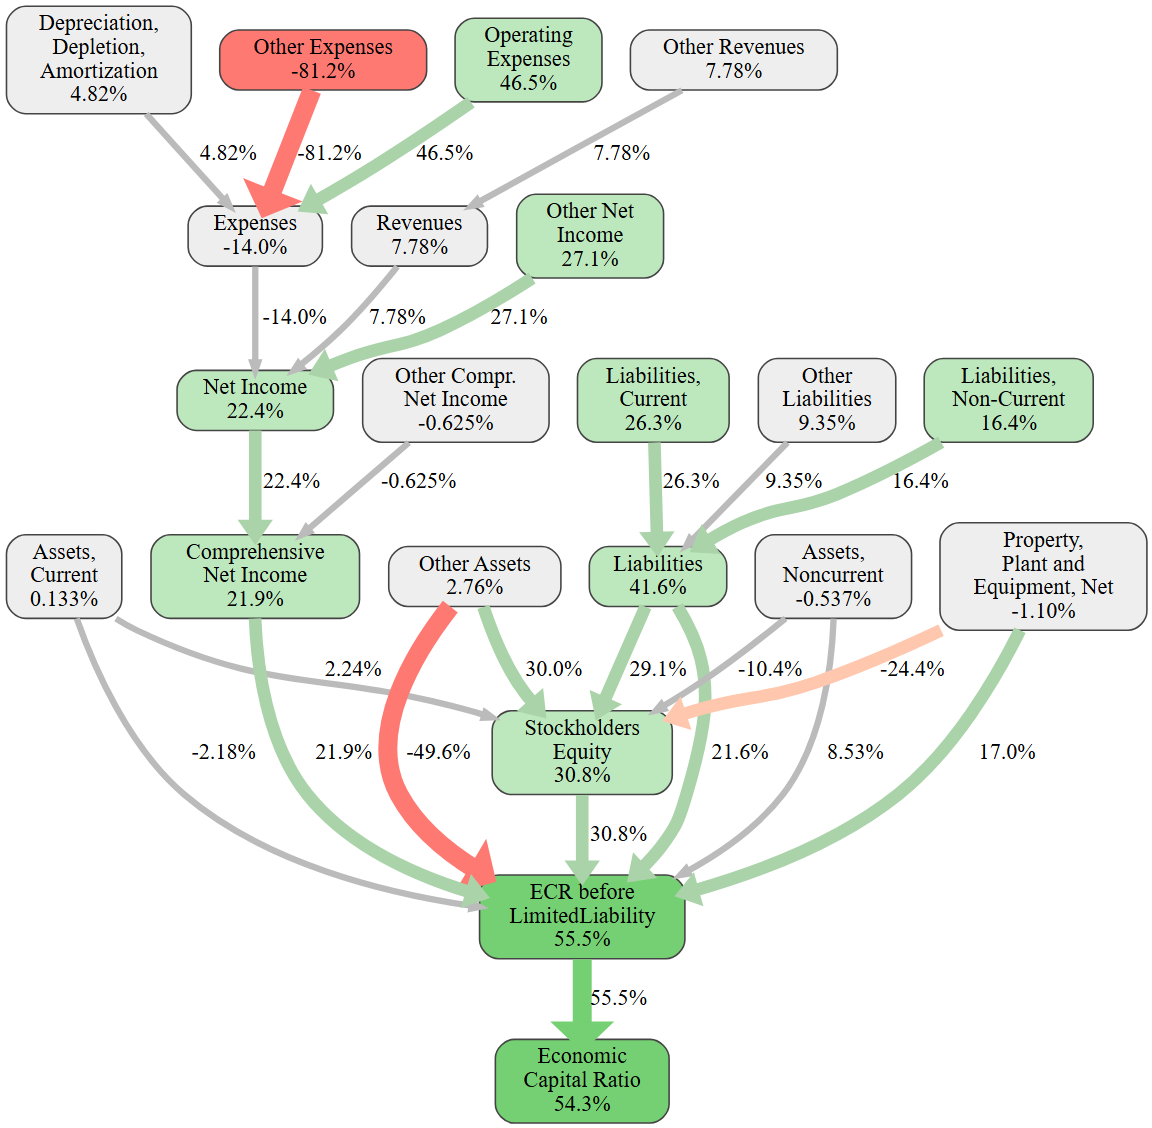
Figure 3 — Strata Critical Medical: causal ECR graph. Each node shows the effect (in ECR pp) of that variable vs. the industry average. Green = positive; red = negative. Source: RealRate Archive.
This causal graph lays bare the mechanics of Strata’s ranking leadership. The dominant negative node — Other Expenses at −81.2 pp — is striking: it represents a structural cost category (medical equipment, emergency services overhead) that far exceeds the average aviation-sector company. Yet four substantial positive nodes — ECR before Limited Liability (+55.5 pp), Operating Expenses (+46.5 pp), Liabilities (+41.6 pp), and Stockholders’ Equity (+30.8 pp) — more than compensate. The net result: a final ECR node 54.3 pp above the market average. This company wins because its capital structure and operational cost profile overwhelm the medical cost drag.
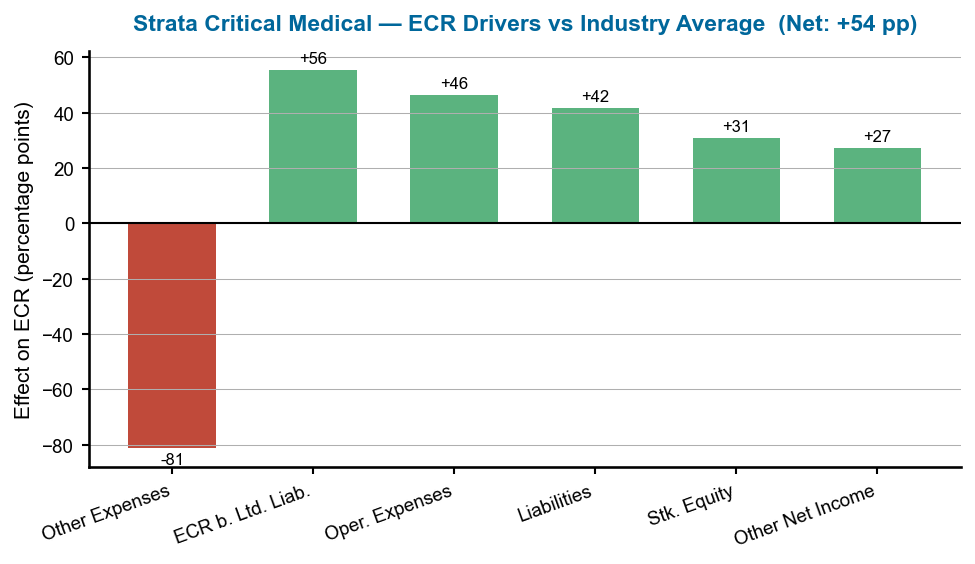
Figure 4 — Strata Critical Medical: ECR drivers versus industry average. Green = positive contribution; red = negative. Source: RealRate Archive.
The bar chart crystallizes the paradox of Strata’s leadership: the deepest red bar in the industry (Other Expenses, −81.2 pp) coexists with four substantial green bars. The ECR before Limited Liability (+55.5 pp) and Operating Expenses (+46.5 pp) are the anchors of its superiority. Liabilities (+41.6 pp) and Stockholders’ Equity (+30.8 pp) add further structural strength. The net +54.3 pp above market average reflects a company that has mastered balance sheet discipline in a cost-intensive medical services context.
2. Saker Aviation Services Inc — The Asset-Light Champion
Saker Aviation Services Inc is a fixed-base operator — a company providing ground handling, fueling, and terminal services at airports — whose business model is about as asset-light as it is possible to be in the aviation world. With just $9.1 million in total assets and $8.7 million in stockholders’ equity against negligible liabilities of $330,000, Saker’s debt-to-asset ratio is effectively zero. Its revenues of $1.3 million and a modest net loss of $1.1 million in 2025 reflect a company in operational transition, yet its capital structure remains the strongest in the industry relative to its asset base.
Saker’s ECR of 102% — 33 percentage points above the 69% market average — rests primarily on two pillars: Current Assets (+70.9 pp), driven by unusually high liquid holdings relative to the sector, and Stockholders’ Equity (+61.0 pp), reflecting near-total equity funding. The main drag is revenues, which are far below the industry average for a company of even this modest size (−29.3 pp), alongside somewhat elevated Other Expenses (−27.9 pp). While Saker lost the top rank it held for three consecutive years, its balance sheet remains among the cleanest in the entire U.S. aviation universe.
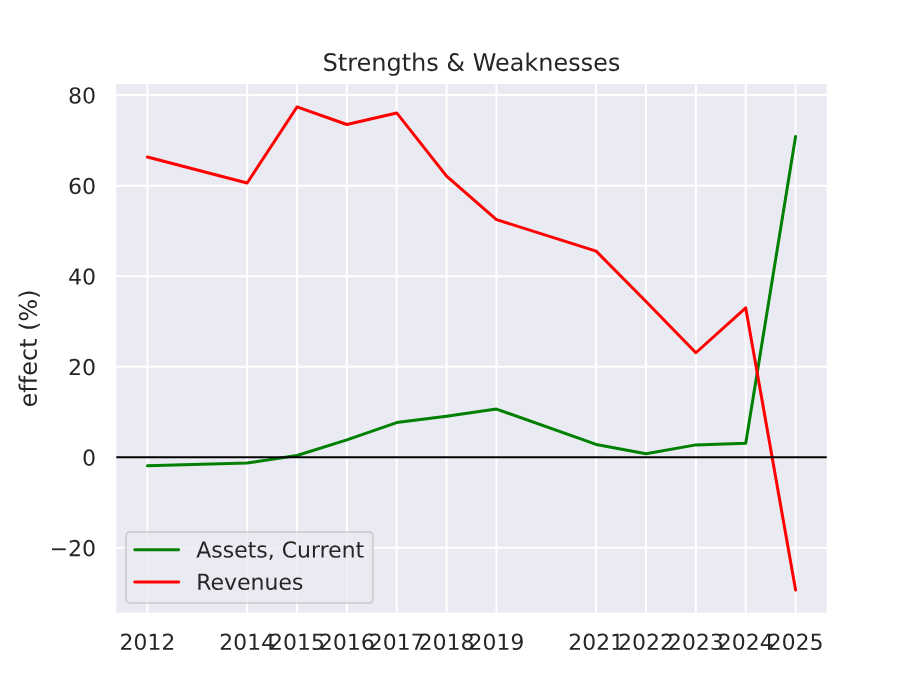
Figure 5 — Saker Aviation Services: ECR strengths and weaknesses over time. Positive (green) boosts ECR; negative (red) reduces it. Source: RealRate Archive.
The strengths and weaknesses chart over time reveals Saker’s persistent advantage: its current asset position and equity structure have been positive factors for many years, providing a durable foundation for high ECR scores. The revenue weakness is not new — Saker has always operated at modest revenue levels relative to its asset base — but it widened in 2025 as operating revenues declined slightly. The equity strength bars (green, top half of chart) consistently outweigh the cost and revenue drags (red, bottom half), explaining how the company maintained top-two status even as its absolute ECR dipped from 129% to 102%.
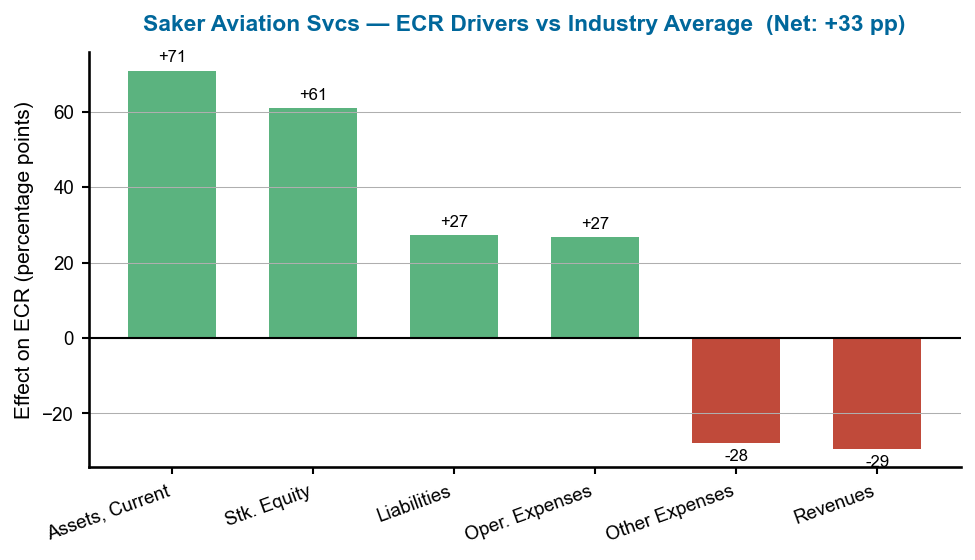
Figure 6 — Saker Aviation Services: ECR drivers versus industry average. Green = positive contribution; red = negative. Source: RealRate Archive.
The two dominant green bars — Current Assets (+70.9 pp) and Stockholders’ Equity (+61.0 pp) — represent Saker’s structural moat: a balance sheet where nearly all assets are liquid and nearly all assets are equity-funded. The red bars — Revenues (−29.3 pp) and Other Expenses (−27.9 pp) — reflect the P&L challenge of a small-scale operator in a service-intensive industry. Liabilities (+27.2 pp) and Operating Expenses (+26.7 pp) add further to the positive side. Net: +32.8 pp above market average, a testament to the power of a debt-free balance sheet.
3. JetBlue Airways Corp — The Airline Sector’s Capital Leader
JetBlue Airways Corp is America’s sixth-largest airline by fleet size, operating more than 1,000 daily flights to approximately 100 destinations. With $9.1 billion in 2025 revenues, it is by far the largest company in the top three by revenue — more than 46 times the revenues of Strata and nearly 7,000 times those of Saker. Yet despite a net loss of $602 million in 2025, its balance sheet tells a story of structural resilience: $12.2 billion in stockholders’ equity against $4.4 billion in liabilities gives an equity-to-asset ratio of 73%, exceptionally strong for a full-service scheduled airline.
JetBlue’s ECR of 85% — 16 percentage points above the market average — is driven by a well-managed liability profile (+15.6 pp), strong property, plant, and equipment position (+15.0 pp), and a favorable Other Expenses structure (+23.9 pp). The primary headwind is Operating Expenses (−26.1 pp), reflecting the massive cost of flying 1,000+ daily routes: fuel, crew, maintenance, and airport fees that far exceed the industry average when measured against assets. Despite posting a loss, JetBlue’s capital structure keeps it firmly in the top three.
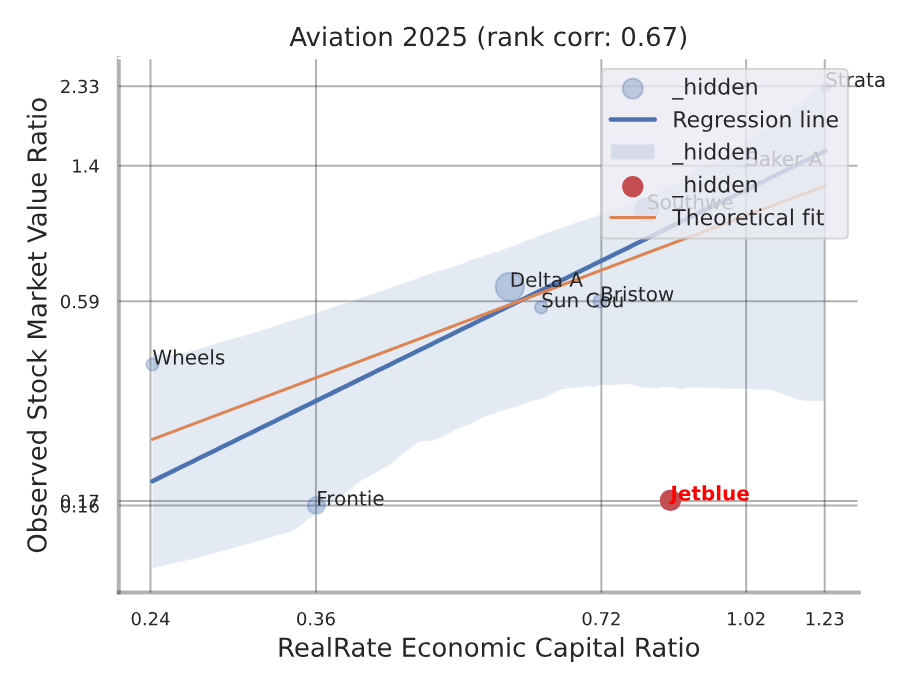
Figure 7 — JetBlue Airways: backtesting correlation plot. The red dot marks JetBlue’s position (ECR vs. observed market value ratio). Source: RealRate Archive.
This backtesting scatter plot maps each aviation company’s RealRate ECR against its observed stock market value ratio, with the red dot marking JetBlue’s position on the correlation axis. The blue regression line (rank correlation 0.67) confirms a moderate-to-strong positive relationship between ECR and market valuation across the industry: higher ECR companies tend to trade at higher market value ratios. JetBlue sits above the regression line — its market valuation is higher than its ECR alone would predict — suggesting the market credits the airline’s recovery strategy and brand strength beyond the raw balance sheet metrics.
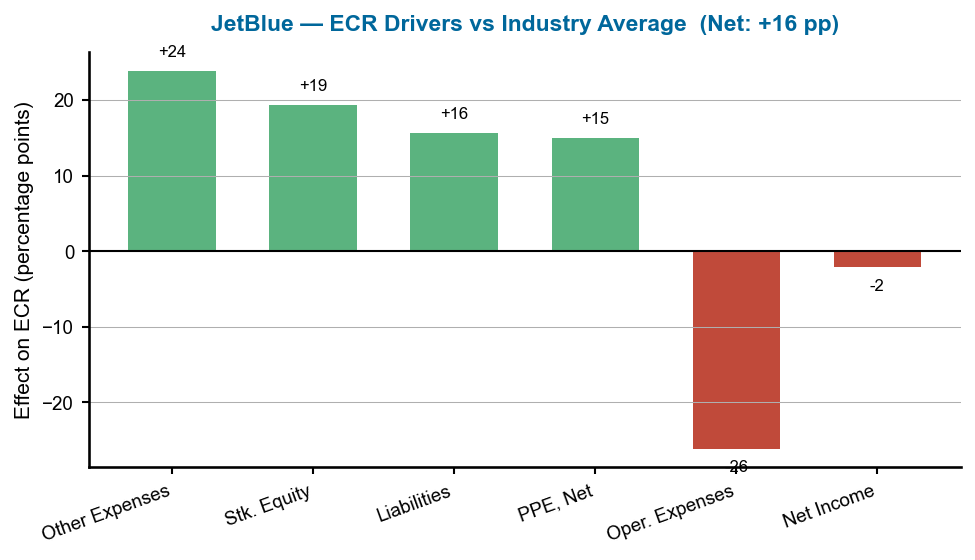
Figure 8 — JetBlue Airways: ECR drivers versus industry average. Green = positive contribution; red = negative. Source: RealRate Archive.
JetBlue’s effects chart is the most balanced of the top three. Other Expenses (+23.9 pp) and Stockholders’ Equity (+19.4 pp) lead the positive contributions, while Liabilities (+15.6 pp) and Property, Plant and Equipment (+15.0 pp) reflect a well-managed asset base for an airline of its scale. The single large red bar — Operating Expenses (−26.1 pp) — captures the structural reality of scheduled airline economics: the cost of operating a modern fleet is simply high relative to any industry benchmark. Net: +15.8 pp above market average — a solid margin for a company absorbing a $602 million bottom-line loss.
What Drives Financial Strength in U.S. Aviation?
RealRate’s model identifies Other Expenses (100% importance), Stockholders’ Equity (95%), ECR before Limited Liability (91.4%), and Operating Expenses (85.4%) as the four most influential variables for ECR across U.S. air industry companies. The dominance of expense-side variables — not revenues or assets — reveals a structural truth about aviation: in a sector where fuel, labor, and maintenance costs can be existential, managing the expense base relative to the asset base is the single most critical determinant of financial resilience. Liabilities (76.9%) and Non-Current Liabilities (71.6%) rank high as well, confirming that leverage management is mission-critical in this capital-intensive industry.
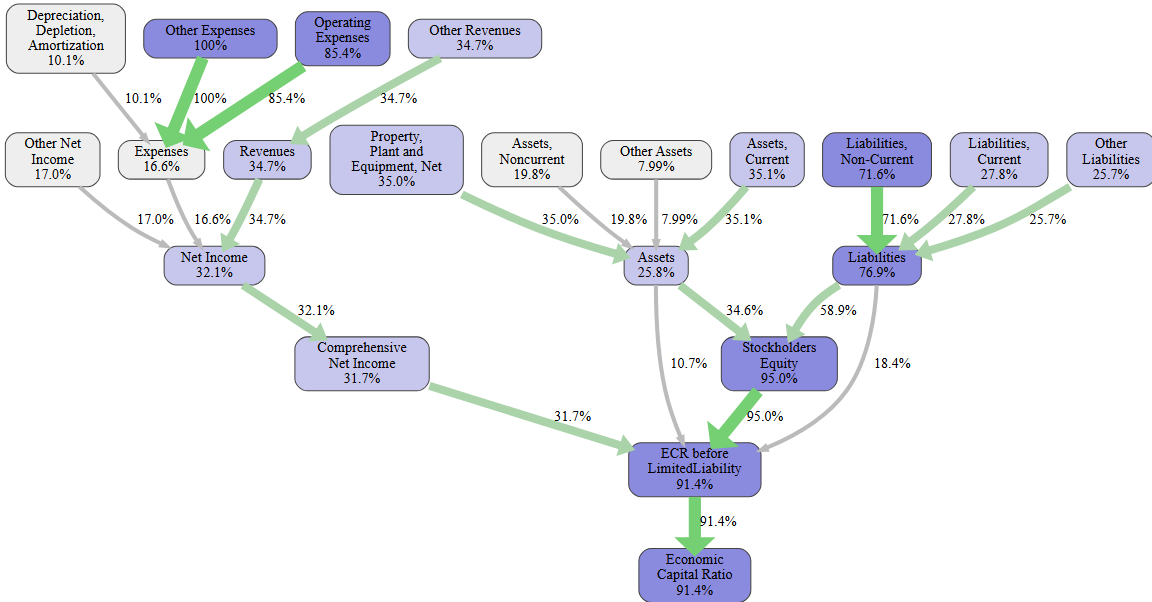
Figure 9 — U.S. Air Industry: feature importance cascade for ECR prediction (industry-level, no company-specific marker). Higher scores = greater influence on ECR. Source: RealRate Archive.
This industry-level causal graph (no black arrow indicating a single company) maps the relative importance of each financial variable to ECR prediction across all U.S. aviation companies. Other Expenses tops the list at 100% — the single most predictive variable in the entire model — followed by Stockholders’ Equity (95%) and the upstream ECR before Limited Liability (91.4%). Operating Expenses (85.4%) and Liabilities (76.9%) round out the top five. Assets and revenue-related variables cluster at 35% and below, confirming that balance sheet discipline and cost management, not top-line size, drive long-run financial strength in aviation.
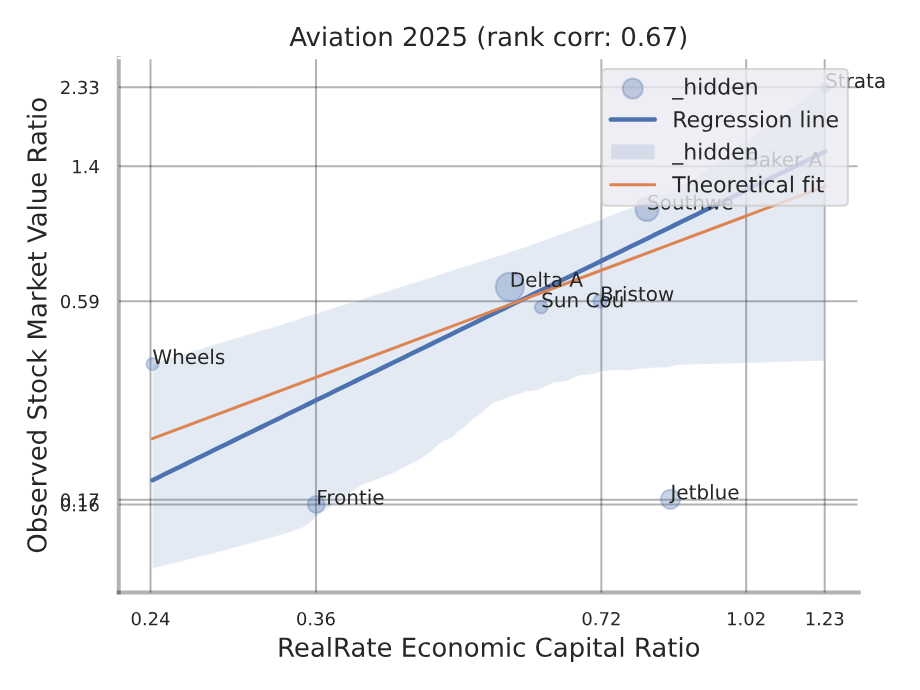
Figure 10 — U.S. Air Industry: backtesting correlation — RealRate ECR vs. observed market value ratio (industry-level, no company red dot). Rank correlation: 0.67. Source: RealRate Archive.
The industry-level backtesting scatter (no red dot, which would indicate a single company) shows the relationship between ECR and observed market value ratios across the full U.S. air sector. The upward-sloping regression line and rank correlation of 0.67 confirm that ECR is a meaningful and validated predictor of market valuation: companies with higher ECR tend to command higher market value ratios, as investors recognize the long-term significance of balance sheet strength. The dispersion around the line reflects the diversity of business models — from micro-cap FBO operators to multi-billion-dollar carriers — that span the industry.
Market Statistics
The market average ECR for U.S. air industry companies in 2026 stands at 69%, recovering slightly from a four-year low of 68% in 2025. Over the past four marketing years the average has ranged from 69% to 74% — declining from 74% in 2023 to 68% in 2025 before the modest 2026 uptick. The gap between the top performer (Strata at 124%) and the market average (69%) is 54 percentage points — one of the widest spreads in any U.S. industry tracked by RealRate. This polarization reflects the coexistence of ultra-lean specialty operators and heavily leveraged legacy carriers within the same industry classification.
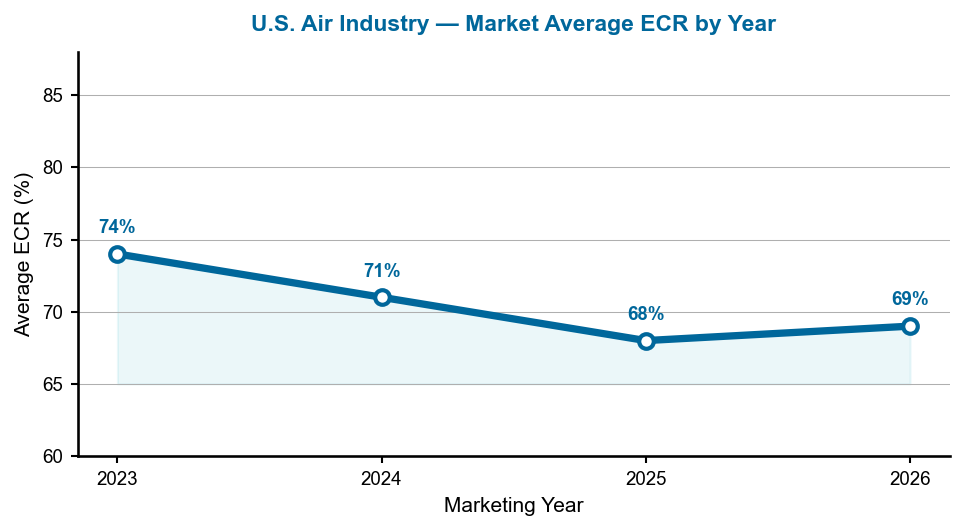
This chart traces the market average ECR’s four-year decline from 74% (2023) to 68% (2025) and its 2026 recovery to 69%. The 2023–2025 compression reflects the ongoing cost pressures reshaping the aviation sector: rising fuel prices, accelerating labor cost inflation from new pilot contracts, and balance sheet stress among carriers still recovering from pandemic-era debt loads. The slight 2026 improvement, while modest, suggests that cost renegotiations and capacity adjustments are beginning to stabilize the sector-wide capital position.
Notable Movers
Strata Critical Medical Inc is the headline mover of 2026, vaulting from rank 2 to rank 1 on the strength of a 34-pp ECR surge. The company’s improved operating cost discipline and equity accumulation drove the advance. Saker Aviation Services, while ceding the top spot, remains a model of balance sheet purity — its decline from 128% to 102% reflects revenue softness rather than any structural deterioration. JetBlue’s consistent top-three presence across multiple years confirms that a well-capitalized large airline can compete with specialty operators on capital metrics. Southwest Airlines Co enters the top four with an ECR of 80% — 11 pp above market average — reinforcing that disciplined fleet and balance sheet management pays off even at massive scale. Delta Air Lines, ranked 7th at an ECR of 57.6%, and Frontier Group at rank 9 (36.1%) illustrate how leverage and cost structures can compress ECR for major carriers even as revenues remain robust.
Manager’s Takeaway
RealRate’s 2026 U.S. Air Industry rankings deliver a clear verdict: the financially strongest aviation companies are not necessarily the biggest airlines. A medical air transport company with $197 million in revenues and a fixed-base operator generating just $1.3 million in annual revenues sit atop the rankings because their balance sheets — dominated by equity and free of meaningful debt — are structurally superior. JetBlue and Southwest demonstrate that even the large carriers can maintain above-average ECR when they invest in equity discipline and manage liabilities conservatively. The common thread across the top four: high equity-to-asset ratios, controlled leverage, and cost structures that compare favorably to the industry norm. In an industry where a single quarter of fuel cost spikes or a labor dispute can reshape a balance sheet, these structural advantages are not just financial metrics — they are survival tools.