Subtitle: Tiny aviation companies outshine major airlines in financial health, as RealRate’s 2025 rankings reveal unexpected leaders and shifting fortunes in the U.S. airline industry.
A Big Industry with Soaring Revenues
The U.S. airline industry is a powerhouse of economic activity. In 2024, major American carriers achieved record revenues, signaling a robust post-pandemic recovery. Delta Air Lines alone generated over $60 billion in operating revenue, with United Airlines close behind – each surpassing pre-2020 levels. Overall, U.S. airlines’ passenger revenues climbed above pre-pandemic benchmarks, contributing substantially to economic growth and supporting millions of jobs nationwide. This booming revenue context sets the stage for an intriguing question: which airlines are making the most effective use of their capital and assets? RealRate’s latest Economic Capital Ratio (ECR) analysis provides some eye-opening answers.
What is ECR? The Economic Capital Ratio is a comparative measure of financial strength that looks at a company’s economic value relative to its total assets. In simpler terms, it’s a solvency and efficiency indicator: how much economic capital (market value of equity plus adjusted net assets) a company has for each dollar of assets on its balance sheet. A higher ECR (expressed as a percentage) means a company is creating more value per asset – making big and small firms comparable on an equal footing.
Importantly, ECR incorporates all aspects of a company’s finances – assets, liabilities, income, expenses – to paint a holistic picture of financial fitness. This year’s results turned conventional wisdom upside-down: some of the smallest players are flying highest on this metric.
Ranking the Top Performers of 2025
According to RealRate’s 2025 Aviation industry ratings (based on 2024 financials), the top three companies by ECR are surprising: Saker Aviation Services Inc (rank 1), Blade Air Mobility Inc (rank 2), and JetBlue Airways Corp (rank 3). These three beat out larger and more famous airlines on this measure of economic efficiency. The chart below highlights the Economic Capital Ratios of these top 3 companies and their ranking:
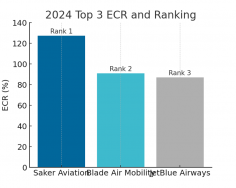
Figure 1: Economic Capital Ratio (ECR) of the 2025 top three U.S. aviation companies. Saker Aviation’s ECR of ~127% leads the pack (Rank 1), far above the industry average (~69%). Blade Air Mobility (Rank 2) and JetBlue Airways (Rank 3) follow with strong ECRs around 91% and 87%, respectively. Higher ECR indicates greater economic value relative to assets.
Notably, Saker Aviation’s ECR of 127% means its economic value is 1.27 times its total assets – an exceptional figure – while Blade and JetBlue, around 90%, also comfortably exceed the average. For context, the industry’s average ECR hovers around 69%, so all three leaders are well above par. This suggests these companies, each in very different niches, are punching above their weight financially.
Why is this surprising? Typically, one might expect giants like American, Delta, or United to dominate any ranking in aviation. Instead, two relatively small firms (Saker and Blade) top the RealRate ECR list, while a mid-sized carrier (JetBlue) comes in third. Meanwhile, some household-name airlines did not even crack the top five in ECR. This outcome reflects how lean balance sheets, high equity, or unique business circumstances can propel a company’s economic capital efficiency beyond that of larger peers. It’s a fresh perspective on industry health, focusing on quality of capital rather than sheer size.
Financial Fitness Over Time: Trends and Changes
How did these top three reach the summit? A look at the historical trends in ECR and rankings provides insight. Over the past decade, JetBlue’s ECR has been relatively stable in the 80–105% range, whereas Saker Aviation’s and Blade’s ECR trajectories were more volatile – and ultimately more steeply upward in recent years.
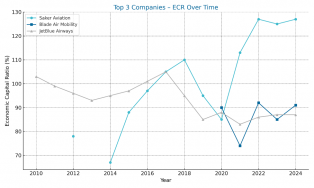
Figure 2: ECR trends (2010–2024) for the eventual top 3 companies. JetBlue (grey line) started high but dipped in the mid-2010s, then recovered by 2018. Saker Aviation (light blue line) had modest ECR until mid-2010s, then skyrocketed from ~70% in 2014 to over 120% by 2021. Blade (dark blue line) entered the scene around 2021 and, after a dip in 2023, climbed again in 2024. Notably, Saker’s ECR jump in 2021–2022 coincides with extraordinary one-time factors (discussed below).
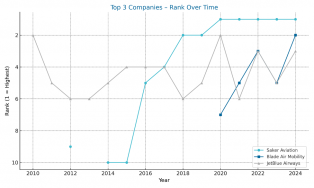
Figure 3: Rank positions of the top 3 over time. (Lower rank number is better; y-axis is inverted so Rank 1 is at the top.) JetBlue (grey line) was among top contenders in 2010 (rank 2), slipped to mid-pack (rank 5–7) during 2011–2015, and rebounded to rank 3 by 2023–2024. Saker Aviation (light blue line) wasn’t even ranked in many early years, but entered at rank 9 in 2012, then fell off, only to surge to rank 1 by 2021 and hold that top spot through 2024. Blade (dark blue line) first appeared in 2021 at rank 7 as a newcomer, improved dramatically to rank 3 in 2022, saw a setback to rank 5 in 2023, and rose again to rank 2 in 2024. These swings underscore the dynamic nature of the industry’s financial health.
The graphs illustrate a changing of the guard over time. For much of the 2010s, JetBlue was the strongest of these three, while Saker was a minor player and Blade didn’t exist (at least not as a public company). But by the early 2020s, Saker caught up and then leapfrogged everyone, and Blade’s arrival shook up the rankings. The rank changes confirm this: Saker Aviation jumped to the #1 spot in 2021 and hasn’t let go. Blade’s best rank to date is #2 (2024), and JetBlue, despite some ups and downs, remains solid in the top tier at #3.
Let’s dive into each of the top three companies to understand why they did so well and what makes them stand out.
1. Saker Aviation Services Inc – Rank 1 of 11
Who are they? Saker Aviation is a niche player operating in aviation services (for example, managing heliports and fixed-base operations). It’s tiny compared to a major airline – and yet it tops the 2025 RealRate rankings. Saker achieved an ECR of roughly 127%, meaning its economic value is 27% greater than its total asset base. What’s behind this exceptional ratio?
The key lies in Saker’s strengths and weaknesses relative to the industry averages. According to RealRate’s analysis, Saker’s greatest strength was its Operating Expenses (or rather, lack thereof). In 2024’s data, Saker had virtually no operating costs – an unusual situation that massively boosted its ECR. This is depicted as a +50% effect on the ECR: essentially, by having far lower operating expenses than peers, Saker’s capital efficiency soared. On the flip side, Saker’s biggest weakness was “Other Expenses”, a category where it had relatively high costs (perhaps related to one-time charges or non-operational expenses). Those dragged its ECR down by about 75 percentage points relative to the market. Despite that weakness, Saker’s net effect remained strongly positive – hence that top ranking.
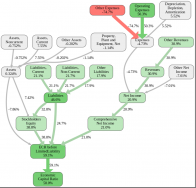
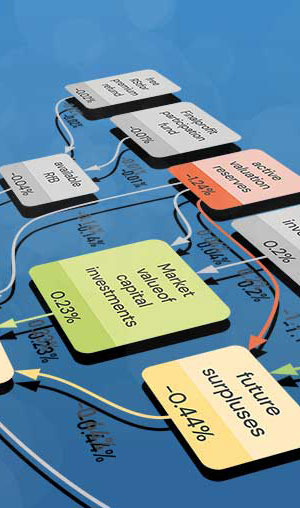
Figure 4: RealRate “effect graph” for Saker Aviation (simplified depiction of how each factor affects its ECR). Green boxes/arrows indicate positive contributions; red indicates negatives. We see Operating Expenses +50.3% (major strength, green arrow), and Other Expenses –74.7% (major weakness, red arrow). The bottom shows Saker’s Economic Capital Ratio 58% above the average (127% vs ~69%). Saker’s zero operating costs in the period made it an outlier on the positive side, while high “other” costs were an outlier on the negative side, yet the net result was a very high ECR.
Why would a company have almost no operating expense? In Saker’s case, an interesting context emerges: during the period, Saker lost a key heliport contract and essentially had no active operations for part of the year. That meant no operating revenue – but also almost no operating expense – as the company was in a holding pattern seeking new business. Paradoxically, this left Saker with a very lean cost structure (temporarily), is seen as a big strength (since typical competitors have heavy operating costs). Meanwhile, Saker did have some “other expenses” (perhaps related to that contract loss or legal expenses), which is seen as a major relative weakness. Even so, with a small asset base, decent remaining equity, and one-off gains like selling assets, Saker ended up with $1.255 million net income on just $10.884 million in assets – a remarkable outcome that translates to that 127% ECR.
From a balance sheet perspective, Saker’s strengths are its low debt and solid equity. At the end of 2024, Saker had about $10.9 million in assets, only ~$1.2 million in total liabilities, and therefore over $9.6 million in equity. This conservative balance sheet (virtually no long-term debt) is a big reason its ECR is high – equity is the economic value the model is measuring, and Saker’s equity is large relative to its assets. In profit-and-loss terms, Saker’s revenues were around $9.17 million for the year, with minimal operating costs, so it managed a healthy profit margin for the period. These figures highlight that Saker is financially nimble: tiny revenues and assets, but also tiny costs and liabilities, creating a high ratio.
Evolution: Saker wasn’t always #1. Its rise to the top of the ranking came post-2020. Before that, Saker hovered in mid-pack. In 2018–2019 it was ranked #2, then took a brief data hiatus in 2020. Come 2021, it re-emerged as #1 and has stayed there through 2024. The evolution over time plot for Saker (not shown here) would reveal a jump in ECR around 2016–2018 and another around 2021. RealRate’s “strength & weakness over time” analysis shows that Saker’s operational cost advantage has grown over time (as it shed operations) while its “other expenses” weakness also grew but was offset by a strong equity cushion.
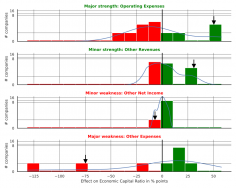
Figure 5: Feature distribution plots for Saker Aviation’s key effects. Each subplot shows the distribution of an effect among all companies (green for positive effects, red for negative, with the blue curve as a density). Black vertical lines and arrows indicate Saker’s position. For example, Operating Expenses effect (top panel) – Saker’s value (black arrow) is at +50% points, whereas most companies cluster near 0% (some even negative). Saker is an extreme outlier on this strength. Conversely, Other Expenses effect (bottom panel) – Saker is at about –75% (black arrow), far to the left of most peers (a major weakness). These charts confirm Saker’s unique profile: minimal operating costs (best in class) but high other costs (worst in class), yielding a net advantage overall.
In summary, Saker Aviation is an unexpected champion, its high ECR fueled by a special situation – essentially no operational expenses – combined with prudent financing (low debt). However, its position may be fragile: if the company remains inactive or if those “other expenses” continue, its fortunes could change. But for 2025, Saker’s efficiency was second to none, making it the unlikely leader of the pack.
2. Blade Air Mobility Inc – Rank 2 of 11
Who are they? Blade is a young, buzz-worthy company specializing in urban air mobility – think helicopters and future electric air taxis offered as an app-based service. It went public via SPAC in 2021, bringing fresh investor capital. Blade’s ECR is ~91%, earning it the #2 rank. This is notable because Blade operated at a loss – so how can a money-losing company be so financially “healthy? The answer: a large equity cushion relative to its assets.
Blade’s balance sheet at end of 2024 shows about $256.7 million in assets and $34.7 million in liabilities, leaving an enormous $221.9 million in stockholders’ equity. Essentially, Blade is sitting on a lot of investor cash (from its SPAC merger and follow-on investments) that it hasn’t spent yet on assets. That high equity drives a strong ECR. Blade’s net income was –$27.3 million (a loss), which actually reduced its economic capital somewhat, but not enough to outweigh the equity base. RealRate’s limited liability adjustment also prevents negative income from dragging ECR below a certain point (Blade’s “ECR before limited liability” was 80%, adjusted up to 91% final).
The RealRate analysis pinpoints Operating Expenses as Blade’s biggest strength, contributing a +58% effect. Why strength, if Blade has big losses? Because Blade categorizes most of its spending not as “operating expense” but under “Other Expenses” (possibly costs of revenue, expansion, acquisition, etc.). In fact, Blade reported zero “Operating Expenses” in the taxonomy used – meaning it has no costs in the specific operating expense category (likely all its costs were in other categories). This is similar to Saker: being an outlier with low or no spending in a category that most companies have a lot of, thus scoring a relative strength. Blade’s glaring weakness, conversely, is Other Expenses, which were very high (over $282 million) – reflecting Blade’s heavy spending on growth, acquisitions, and one-time items. That “Other Expenses” variable hit Blade’s ECR with a –132% effect, the largest in absolute terms among all companies. In short, Blade spent an extraordinary amount (relative to its size) outside of operating costs, which slashed its profitability. However, because Blade’s equity was so high, it could afford this and still retain a high ECR.
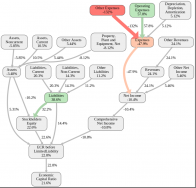
Figure 6: Effect graph for Blade Air Mobility. Operating Expenses +57.8% (green arrow at top right) and Other Expenses –132% (big red arrow) dominate the picture. Blade’s Expenses overall were far above average (hence large negative net income effect), yet its Stockholders’ Equity 22.6% (green) and other capital components kept its ECR before adjustment at ~22.8% above average, ending with an ECR about 21.6% above average (i.e., 91% ECR vs 69% average). The diagram visualizes Blade’s scenario: lots of green on equity side, a huge red hit from other expenses, but still ending well above water in ECR.
Looking at Blade’s finances in plain terms: Blade had ~$249 million revenue in 2024 against $282 million in expenses, yielding a substantial loss. Yet, thanks to prior funding, it still has more assets than liabilities (mostly cash and short-term investments). Blade’s high ECR tells us that investors’ money is still largely intact (Blade hasn’t burned through all its cash or taken on debt). As a result, Blade can be seen as financially healthy (solvent with cushion), albeit not yet profitable. This distinction between profitability and ECR is crucial – ECR is about capital efficiency and solvency, not a direct profit ranking.
Blade’s journey over time is also fascinating. In 2021, Blade’s first year in the ranking, it debuted at rank 7. By 2022, it shot up to rank 3 as its equity from the SPAC was fresh and largely unused. In 2023, Blade slipped to rank 5 – that year, Blade’s losses and some asset usage likely lowered its ECR temporarily to ~74%. By 2024, Blade rebounded to rank 2 as it managed to maintain a strong capital base and perhaps had some improvement in ratios. The volatility reflects Blade’s startup phase: as it spends capital, its ECR can drop, but if it raises more capital or if expenses normalize, ECR can rise. So far, Blade has been on top of the smaller airlines and even beat larger ones due to its hefty equity.
From an industry perspective, Blade’s success in the ranking suggests that having a war chest of cash sets a company apart. Many traditional airlines carry significant debt and were hammered by pandemic losses; Blade, in contrast, entered with no debt and plenty of investor cash, allowing it to endure losses while still looking “safe” financially. It’s a reminder that in terms of pure capital ratio, bigger isn’t always better – what matters is the proportion of equity to assets. Blade’s equity is 86% of its assets, which is far higher than, say, Delta or American (which run closer to 20–30% equity ratios).
3. JetBlue Airways Corp – Rank 3 of 11
Who are they? JetBlue is a well-known U.S. airline – a major carrier but not as large as the “Big Three” (American, Delta, United). It has been a consistently innovative and customer-friendly airline. Financially, JetBlue finds itself in third place with an ECR around 87%. This means JetBlue’s economic capital (market value + adjusted net assets) is about 0.87 times its asset base – a strong showing above the average. How did JetBlue achieve this, especially coming out of the tough pandemic years?
JetBlue’s strength, is Stockholders’ Equity. Indeed, JetBlue’s balance sheet as of 2024 had roughly $16.84 billion in assets and $3.88 billion in liabilities, implying nearly $12.96 billion in equity. That’s an equity-to-assets ratio of about 77%, which is very high for an airline (many airlines are heavily leveraged; JetBlue appears to have retained strong equity, possibly through government support and capital raises during the pandemic). This high equity yields a +25% effect on ECR relative to peers – meaning JetBlue is much better capitalized than the average airline, which boosts its ECR significantly.
JetBlue’s weakness was Operating Expenses, with a –21% effect. JetBlue, like all airlines, has substantial operating costs (fuel, labor, etc.). In fact, by 2024, as travel ramped up, JetBlue’s operating expenses soared (over $8.39 billion in operating costs). JetBlue’s operating expenses is higher (relative to assets) than the industry norm, thus penalizing its ECR somewhat. This reflects that JetBlue’s cost base, while necessary to generate revenue, is heavy in proportion to its asset size when compared to smaller or more efficient operators.
Even with a net loss in the year (JetBlue had a net income of –$795 million in 2024 data), JetBlue’s ECR remained robust because of that equity cushion and the model’s limited liability adjustment. Before adjustment, JetBlue’s “ECR before limited liability” was about 74% – after adjustment, it stands at 87%. This indicates that if we ignored the rule that caps the impact of negative net income, JetBlue’s ratio would have been lower, but RealRate’s approach prevents extremely negative earnings from pushing the metric below the equity fraction. Essentially, JetBlue’s ECR shows it still has substantial intrinsic value (equity) despite recent losses.
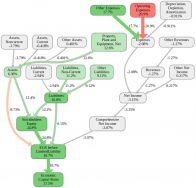
Figure 7: Effect graph for JetBlue Airways. Here, Stockholders’ Equity +24.8% is a prominent green contributor on the left, reflecting JetBlue’s strong equity base. Operating Expenses –20.9% is shown as a red arrow on the right, indicating JetBlue’s cost intensity hurt its ECR. Other factors like Assets and Liabilities have moderate effects (green “Assets 6.36%”, etc.). In total, JetBlue’s ECR ended about 18% above average (i.e., a final ECR ~87%). This aligns with JetBlue being well-capitalized but facing cost pressures.
In plain language: JetBlue’s balance sheet is relatively solid – thanks to financing and perhaps prudent management, it isn’t overburdened with debt. That’s a key strength as captured by ECR. On the other hand, JetBlue’s income statement shows high expenses (fuel prices, operational costs in a competitive market), which currently outpace its revenue (around $9.28 billion in revenue vs $9.86 billion in total expenses for the year). The result was a net loss and a slight decrease in equity year-over-year. Even so, JetBlue’s ECR of 87% is well above most competitors like legacy carriers (many of which have ECRs in the 40–50% range). It underscores that JetBlue entered 2025 in a comparatively healthy financial position, giving it resilience.
Over time, JetBlue’s ECR and rank have fluctuated. It was near the top in 2010 (rank 2), drifted down during the mid-2010s as costs rose (reaching rank 7 by 2015), then climbed back up as it managed its finances and others faltered (back to rank 3 by 2023). The pandemic era (2020–2021) saw JetBlue temporarily drop (it was rank 6–7 in those years, likely due to huge losses that eroded equity). But government aid, capital raises, and a rebound in demand helped JetBlue restore its balance sheet enough to improve again. As of the latest data, JetBlue stands out as the financially strongest among the traditional U.S. airlines, even though smaller firms outrank it.
JetBlue’s total liabilities of ~$3.9 billion are actually quite low relative to an airline of its size – possibly because long-term debt was paid down or restructured. It’s noteworthy because airlines often carry large debt for aircraft financing. JetBlue’s equity percentage (over 75%) suggests it might have raised equity capital or not accumulated debt as much as peers (or had significant negative equity in other carriers’ cases). For example, compare to a giant like Delta, which has tens of billions in debt – JetBlue’s lighter debt load is a strategic advantage reflected in ECR.
Profit & loss: JetBlue’s weakness – operating expenses – is partly a structural industry issue (airlines are cost-intensive) and partly efficiency. RealRate’s model indicates JetBlue’s costs were higher relative to its assets than some others. This might imply JetBlue’s assets (like its fleet value) are not as high (they have many leased aircraft perhaps), but its operating costs are significant, which could hurt ECR. It’s a prompt for JetBlue to seek cost efficiencies as it merges with or acquires other airlines (JetBlue has been attempting to acquire Spirit Airlines, which if successful, will change these metrics in future years).
Other Notable Movers and the Rest of the Pack
RealRate’s 2025 ranking covered 11 U.S. aviation companies in total. Outside the top 3, there were some interesting moves:
- Spirit Airlines (Spirit Aviation Holdings Inc) fell from rank 2 last year to rank 4 this year. Spirit’s ECR for 2024 came out around 83%, a drop from over 93% previously. This decline in rank (and ECR) likely reflects higher costs or a thinner equity cushion – indeed, Spirit took on debt for new planes and had operational challenges, which might have reduced its relative capital ratio. Still, Spirit remains among the higher ECR companies, just behind JetBlue. (It’s no coincidence JetBlue and Spirit are contemplating a merger – both are comparatively healthier than many rivals.)
- Southwest Airlines (rank 5) is another strong performer, with an ECR about 80%. Southwest has long been known for a conservative balance sheet and consistent profits. However, its rank of 5 indicates that smaller or newer companies outpaced it in relative terms. Southwest’s heavy assets (lots of aircraft owned) and a recent stumble with operational disruptions may have moderated its ECR. Nonetheless, Southwest’s finances are solid compared to most peers.
- Down the list, we see large legacy carriers: Delta Air Lines came in at rank 9 with an ECR around 50%. Delta’s ECR is far lower than the leaders’ because Delta has a high debt load and had significant pandemic losses. Similarly, Frontier (rank 10, ~39% ECR) and Wheels Up (rank 11, ~25% ECR) occupy the bottom. Wheels Up, a private aviation provider, in particular struggled – its very low ECR of 25% suggests its economic value (market cap plus adjusted net assets) is only a quarter of its asset base, a potentially worrying sign. Indeed, Wheels Up faced severe financial distress in 2024 with mounting losses, which this metric captures.
- Air Transport Services Group (ATSG) and Sun Country Airlines were ranked 8 and 7 respectively, each with ECR just under 60%. These mid-size players had moderate equity ratios. ATSG (an air freight and leasing company) historically carries more debt for aircraft, while Sun Country, a leisure airline, has been profitable but not hugely capitalized. Both saw their ECRs around the middle of the pack.
One notable observation is how American Airlines Group did not appear in the top 11 at all in 2025’s RealRate list. In the archive data, American had a negative or very low ECR in recent years (due to massive debt and losses), possibly causing it to be excluded or to rank below the cutoff. This underscores the stark contrast: a household-name airline like American can be lower in financial health by this measure than much smaller entities.
What about the market as a whole? The average ECR among the 11 companies was about 69%. The standard deviation of ECRs was quite high (~27 percentage points), reflecting a wide disparity – from Saker’s 127% to Wheels Up’s 25%. The average change in ECR from the previous year was only slight (+1–2 points), suggesting the industry’s overall capital ratio didn’t change dramatically on average, even though individual companies swung significantly. This means for every Blade that improved, there was a Spirit that declined, balancing out. Still, the trend over the past couple of years is that the average ECR recovered after 2020’s hit – thanks to government aid and capital raises, many airlines bolstered their balance sheets in 2021, lifting the average. Now, as of 2025, we see a bifurcated landscape: a few companies with extremely high ECR (often due to unique circumstances) and several with quite low ECR, with not many in the middle.
Strengths, Weaknesses, and Looking Ahead
Each of the top 3 companies showcases a different strategy and set of strengths/weaknesses:
- Saker Aviation – Strength: ultra-lean operations. Weakness: lack of revenue diversity (dependent on new business to sustain itself). Saker’s plot of strengths/weaknesses over time indicates it consistently kept liabilities negligible and occasionally benefited from irregular income, but any return to normal operations will introduce operating expenses again. Saker’s challenge is to find new revenue without bloating its cost base. Its strengths and weaknesses graph over time shows huge swings – a sign of instability that could either correct or propel it depending on 2025 activities.
- Blade Air Mobility – Strength: high investor equity, visionary growth potential. Weakness: heavy cash burn (“Other Expenses” like large investments). Blade’s strategy is to spend now to build the future of urban air travel. The strengths/weakness over time for Blade will likely show that it started with strong equity (green bar) and increasingly large other expenses (red bar) year by year. Blade’s future ranking will depend on balancing growth with demonstrating a path to profitability. If Blade’s spending moderates or revenues catch up, its ECR could remain high; if it burns through its cash reserve without replenishment, ECR will fall.
- JetBlue Airways – Strength: solid capitalization and brand, relatively low debt for a major airline. Weakness: high operating costs and recent losses. JetBlue’s strengths/weaknesses profile is more balanced compared to the extremes of Saker or Blade. Over time, JetBlue’s graph shows consistent positive equity effects and moderate negative expense effects. To improve further, JetBlue will aim to return to profitability (turn that operating expense effect from a weakness into at least a neutral factor). Its planned merger with Spirit, if approved, could create efficiencies of scale but also integration costs – something to watch in future ECR calculations.
For the industry, financial stability has improved since the dark days of 2020–2021, but the RealRate ratings reveal that not everyone has healed equally. Smaller, agile companies (or those freshly capitalized) have outpaced some legacy carriers in relative financial health. This could have implications: well-capitalized airlines can invest in new technology, better service, or expansion, whereas those with low ECR (indicating heavy debt or eroded equity) may struggle to keep up or to survive another shock.
Finally, how do these ratings correlate with market perception? It’s interesting to note the market capitalization vs ECR regression:
![]()
Figure 8: Regression analysis of observed market value vs RealRate ECR for 2024. The plot (blue line with confidence band) shows a positive correlation (rank correlation ~0.33) between a company’s ECR and its stock market valuation relative to assets. Each dot is a company (some labeled: e.g., Wheels Up at far left, JetBlue lower right, Southwest near the line). Saker Aviation (red point labeled) sits above the theoretical fit line, indicating its market value is even higher than its high ECR would predict. Meanwhile, JetBlue’s market value (dot labeled JetBlue) is slightly below where its ECR might suggest. This modest correlation suggests that while ECR influences investor confidence, other factors (like growth prospects, risk, and company size) also play big roles in market valuation.
Companies with high ECR tend to have better market value multiples, but it’s not a perfect relationship. The fact that Saker is an outlier (market cap outsized for its assets and ECR) could indicate speculative investor optimism, whereas JetBlue’s relatively low market multiple shows investors also weigh current profitability and scale (JetBlue had a loss, which tempered enthusiasm despite good ECR).
In conclusion, RealRate’s 2025 aviation ratings have shone a spotlight on the financially fittest in the industry, with some unconventional winners. A tiny heliport operator and a nascent air mobility firm proved more capital-efficient than airlines carrying millions of passengers. This illustrated that strong balance sheets and prudent financial management can make a huge difference – often more so than sheer revenue size. As the airline industry continues to recover and evolve (with new technologies and possibly consolidation on the horizon), keeping an eye on Economic Capital Ratios offers a unique perspective on who is truly built to last in the high-flying world of aviation.