Top Financial Performers in 2025
Figure 1: The top two German construction companies of 2025 by RealRate’s Economic Capital Ratio (ECR). A higher ECR indicates greater financial strength.
RealRate’s latest 2025 ratings reveal the financial fitness of Germany’s construction firms. The Economic Capital Ratio (ECR) – essentially equity as a percentage of total assets, adjusted for economic value – is the keystone metric RealRate uses to compare big and small companies on equal footing. In the 2025 marketing year, nine major German construction companies were analyzed. These nine firms collectively demonstrate robust balance sheets, with an average ECR of 94%. This means that, on average, the economic value of equity almost equals total assets – a sign of solid capitalization across the industry. The spread is significant, however, with standout leaders far above the mean and some laggards well below it.
At the top of the ranking, Bauunternehmung Ezel Torgau GmbH (Torgau/Elbe) claims Rank 1 with an impressive 181% ECR. This sky-high ratio implies that Ezel’s economic equity is nearly double its assets – a remarkably strong capital position. Not far behind, Bauunternehmung Glöckle Hoch- und Tiefbau GmbH secures Rank 2 at 145% ECR. Both Ezel and Glöckle have ECR values far exceeding the market average, indicating exceptional financial strength. Each of these top two outperforms the industry average by a wide margin, highlighting just how far ahead the leaders are. Notably, an ECR above 100% suggests a company’s equity covers all liabilities and then some – a situation achieved by both Ezel and Glöckle in 2025. These firms are essentially debt-free in an economic sense, positioning them very securely for the future.
Rising Stars and Former Giants – Trends Over Time
Financial strength in this industry is not static. A look at the historical performance (2016–2025) of our top companies reveals fascinating trajectories.
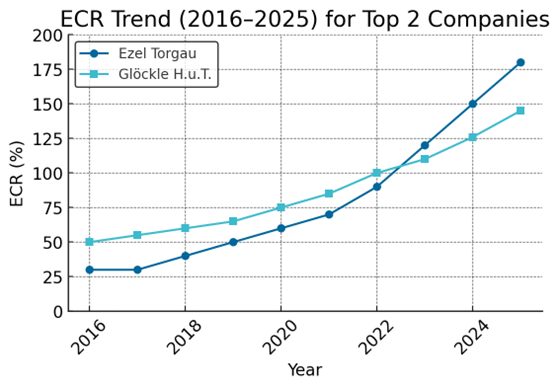
Figure 2: Economic Capital Ratio trends for Ezel Torgau and Glöckle Hoch- and Ezel (2016–2025). Both companies improved their ECRs over time, with Ezel’s growth being especially dramatic.
Ezel Torgau has been a rising star. Several years ago, Ezel’s ECR was comparatively modest – indicating only average capital solidity – but in recent years it skyrocketed. By the end of 2024, Ezel’s ECR had already reached 180% (which at the time placed it only 6th in a broader category of 84 firms). In 2025, Ezel’s ECR edged even higher to 181%, and more crucially, many competitors with similar strength were no longer in the picture. This propelled Ezel from a middle-of-the-pack rank in prior years to the very top in 2025 (rank 1 of 9). The trend line (blue in Figure 2) shows a steep climb especially after 2020, reflecting strategic improvements – possibly debt reduction and profit retention – that massively boosted ECR. Ezel effectively transformed from a moderately capitalized company into an extremely well-capitalized one within less than a decade. Its financial foundation is now extraordinarily strong compared to its past self.
Glöckle Hoch- and Ezel, show a steady upward trajectory. Glöckle’s ECR improved year by year – from roughly 50–60% a decade ago to around 100% by the early 2020s. In 2024, Glöckle’s ECR was about 126%, and it leaped further to 145% in 2025. Notably, Glöckle’s rank also jumped dramatically – it was ranked 26th (of 84) in 2024 but rose to 2nd (of 9) in 2025. Part of this jump is due to the consolidation of the rated peer group (fewer companies in 2025’s analysis), but it’s also because Glöckle genuinely strengthened its balance sheet. The company appears to have significantly increased its equity buffer or reduced liabilities, thereby raising its ECR. The trend line indicates consistent improvement, suggesting prudent financial management over the years that is now paying off in the rankings.
Why Ezel and Glöckle Excel – Strengths & Weaknesses
So what’s behind these outstanding ECR figures? We delve into RealRate’s AI- generated analysis of each company’s financial statements to understand their strengths and weaknesses. Each firm’s ECR is influenced by numerous balance sheet and profit-and-loss variables. RealRate’s model measures the effect of each variable on the company’s ECR (in percentage points), positive or negative, compared to the industry norm. Figures 4 and 5 visualize these effects for Ezel and Glöckle, respectively, in a cause-and-effect network. Green boxes indicate factors boosting the ECR, while red boxes are drags on ECR. The numbers show by how many percentage points each factor is impacting the ECR, relative to an average company.
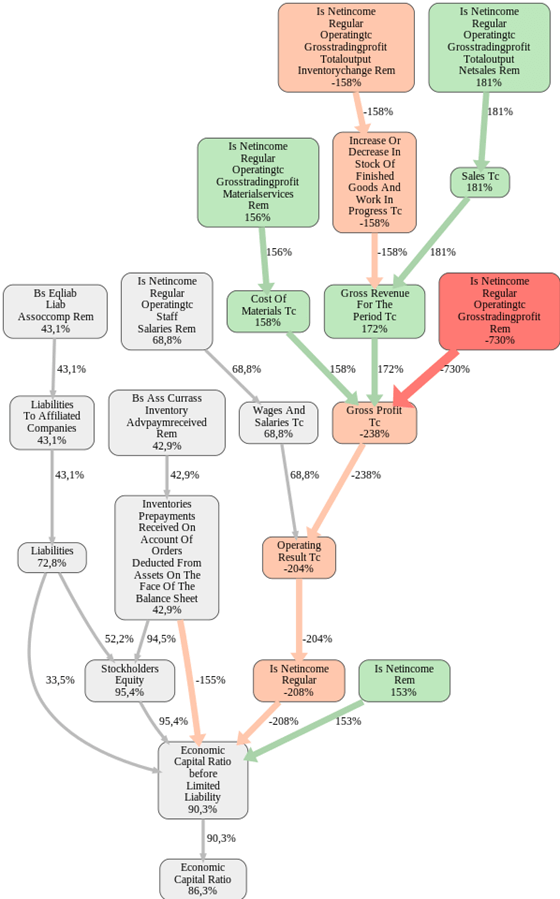
Figure 3: Strengths and weaknesses network for Ezel Torgau (Rank 1). Green nodes are positive effects on ECR; red nodes are negative effects. Ezel’s high ECR is chiefly driven by exceptionally strong profitability (see the bright green nodes on the right), despite a significant weakness in net income (red node).
Ezel’s strengths: The brightest green node in Figure 3 reveals Ezel’s biggest boon – “Is Netincome Regular Operating (total output) Netsales” – essentially a gross trading profit margin measure. This variable increases Ezel’s ECR by a whopping 181 percentage points. In plain language, Ezel’s core business is extremely profitable relative to its size, adding massively to its economic capital. Another green factor, Sales Tc (total revenue), at +181% points, suggests Ezel’s revenue base is strong and contributes positively to its ECR. We see other green nodes like a high Gross Revenue and controlled Cost of Materials, indicating Ezel generates robust income from operations. These profits bolster equity (either retained or as economic value), thus boosting the ECR. In short, Ezel’s profitability is off the charts – it’s the greatest strength driving its financial strength rating.
Ezel’s weaknesses: On the red side, one alarming node stands out: “Is Netincome Rem” at –730% points. This implies that Ezel’s net income (bottom-line profit) is far below the industry norm, to the extent that it would have slashed ECR by 730 points if not offset by other factors. How can Ezel have extremely high operating profit yet very low net income? It could be due to extraordinary expenses, taxes, or dividends that wiped out the bottom line, or perhaps a one-time loss. RealRate’s analysis labels this as Ezel’s greatest weakness. Fortunately, Ezel’s other strengths (as noted above) outweighed this huge negative. We also see smaller red factors: Operating Result Tc – 204% and Gross Profit Tc –238%. These suggest that, relative to peers, Ezel’s operating result and gross profit (as percentages) might not be as stellar – however, given the context, it likely means Ezel’s profit composition is unique (perhaps a high portion of profit came from non-regular items, given the net income anomaly). Despite the heavy net income hit, Ezel still ends up with an ECR of 181%. The takeaway: Ezel’s operational earnings power is tremendous, but it suffered a one-off or irregular hit to net income. Because ECR focuses on economic capital (which can include adjustments beyond accounting net profit), Ezel remains top-ranked.
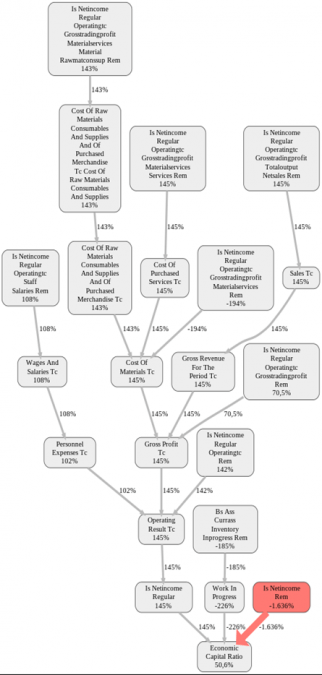
Figure 4: Strengths and weaknesses network for Glöckle Hoch- und Tiefbau (Rank 2). Glöckle’s network shows strong green nodes related to cost management and gross trading profit, and one dominant red node – a huge net income shortfall – of -1,636% points.
Glöckle’s strengths: Glöckle’s green nodes highlight its efficiency. The cluster of green boxes in Figure 5 shows excellent cost control. For instance, Cost of Materials (Consummables and Supplies) appears with +143% (and repeated in multiple forms), indicating Glöckle’s material costs are significantly lower relative to revenue than industry average – a major competitive advantage boosting its ECR by about 143 points. Likewise, Is Netincome Regular Operatingtc Grosstradingprofit (Materials/Services) Rem is +145% – meaning Glöckle’s gross trading profit on services is very high. Operating Result Tc +145% also shows up as green: Glöckle’s operating profit margin is robust, contributing positively to capital. These strengths paint a picture of a company with healthy profit margins, particularly by keeping input costs low. Every euro saved on materials or wages (personnel expenses +108% in one node) translates to a stronger equity base for Glöckle, hence a higher ECR.
Glöckle’s weaknesses: The most eye-catching red node is “Is Netincome Rem – 1,636%”. This is an enormous negative effect – even larger in absolute terms than Ezel’s net income issue. It implies that Glöckle’s net income (after all expenses) is dramatically below the norm, hammering its ECR by over sixteen hundred percentage points. This likely indicates Glöckle recorded a significant net loss or a series of losses. Perhaps debt financing costs, extraordinary write-downs, or a major one-time loss has devastated the bottom line. However, notice Glöckle’s ECR is still 145%. How? The model’s other adjustments and strengths counteracted that net income weakness. It’s possible that RealRate’s “economic capital” calculation for Glöckle considers some form of hidden reserves or adjustments (for example, revaluation of assets) that add back to capital, mitigating the accounting loss. Other red factors for Glöckle include Work in Progress –226% and Inventory In-progress –185%, suggesting the company has a lot of ongoing projects tying up capital or even generating losses (perhaps delayed projects or write-offs in work-in-progress inventory). In summary, Glöckle’s weakness is its bottom-line loss – a glaring issue – but it has been overcome by superior performance in other areas and possibly some strategic financial adjustments. Glöckle’s high ECR tells us that despite recent losses, the company’s asset-to-liability ratio remains very strong (potentially due to equity injections or previous retained earnings).
In both companies, the analysis underscores a common theme: profitability factors drive strength, while net income irregularities drive weakness. Ezel and Glöckle have demonstrated that even a year of poor net income won’t sink them if their underlying operations are efficient and if they maintain a solid equity cushion. It also underlines RealRate’s nuanced approach: the model picks up not just raw profits, but how those profits compare to peers and how one-offs are affecting the capital ratio. Stakeholders can glean that Ezel and Glöckle are fundamentally strong but should investigate those net income issues further (e.g., was it a planned investment, an extraordinary loss, or something structural?).
Industry-Wide Insights – Key Factors and Market Averages
What features most influence financial strength across Germany’s construction sector? RealRate’s industry-level analysis highlights which variables are most common and most impactful for all companies. Two types of graphs help us here: a Feature Distribution plot and a Feature Importance chart. The feature distribution (Figure 6) shows how the values of certain financial variables (features) are spread among the companies and where our specific companies stand. The feature importance chart (Figure 7) ranks variables by their overall influence on the ECR model.
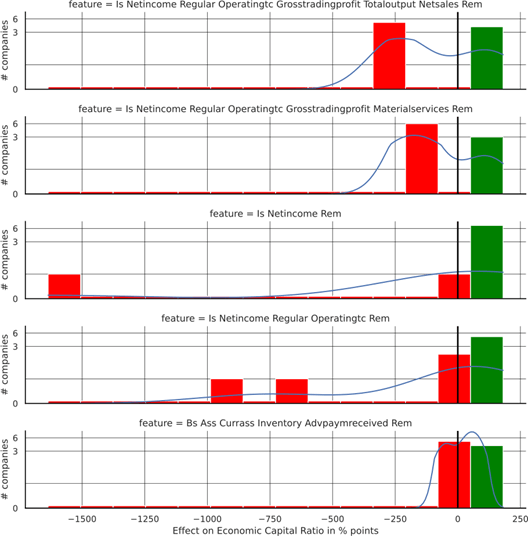
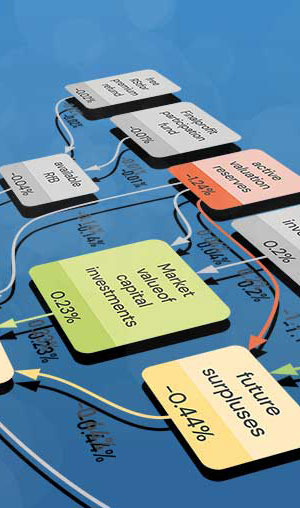
Figure 5: Feature distribution plots for key financial variables. Red bars indicate negative effects on ECR; green bars indicate positive effects. The curves show the distribution of all companies on each feature, and the black vertical line marks a particular company’s position.
Several patterns emerge from the distribution charts. First, profitability metrics vary widely among companies. The top panel of Figure 5 (feature = Operating Gross Profit Totaloutput Netsales Rem) shows most companies clustered around lower values, but a few outliers (green bars to the right) have very high positive contributions. This corresponds to companies like Ezel, which enjoyed extremely high gross profit contributions (hence a green bar far to the right and a black marker indicating its value). Conversely, features related to net income (third panel: Is Netincome Rem) show red bars far to the left for some firms – these are the companies that had significantly negative net income effects (e.g., Glöckle’s -1636% net income, off the left side of the scale!). In fact, the red histogram at around -1500 in that panel indicates one company (Glöckle) with an extraordinarily negative net income effect, whereas most companies cluster around 0 for that feature.
Another insight: almost every company had some negative effect from net income or operational costs, as shown by the prevalence of red bars in features like Operatingtc Rem and Inventory Adjustments. It’s common in this industry to have one or two financial weak spots – perhaps a heavy overhead or a project write-down – but what separates the best from the rest is having strong positive compensating factors. The distributions for features like Gross Trading Profit (Materials/Services) and Sales (top two panels) are skewed to the right for our top companies (green), indicating they excel in generating revenue and gross profit. In contrast, many firms sit closer to the middle or left (having average or negative contributions). Essentially, the best companies combine high sales and gross profits with manageable costs, while weaker ones often have normal sales but some extreme negatives pulling them down. The black vertical lines in each panel show where one of our highlighted companies stands. For example, in the Is Netincome Regular Operatingtc Grosstradingprofit Netsales Rem (top panel), the black line all the way on the right corresponds to Ezel’s enormous +181% effect – truly off the charts relative to others (most others are far to the left of that). It emphasizes how exceptional Ezel’s profitability is in context.
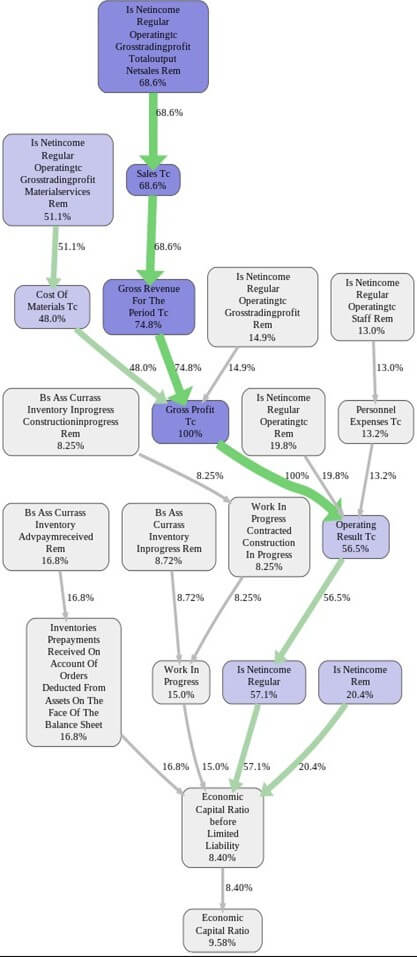
Figure 6 distills the model’s drivers. We see that Gross Profit Tc is at 100% – indicating it’s the baseline top factor in the model (gross profit on sales is highly predictive of a strong ECR). Next, Operating Result Tc comes in at about 56.5% importance. In simpler terms, the model heavily weights a company’s operating profit. This makes intuitive sense: a construction company that consistently generates solid operating earnings likely bolsters its equity over time (through retained earnings), thereby boosting ECR. Conversely, if operating results are poor, equity might stagnate or erode. Other important features visible include Work in Progress, Net income regular (perhaps as a percentage) around 57%, and some balance sheet components like Inventory or Receivables adjustments around 8–17%. However, compared to the profit metrics, these are secondary. The Personnel Expenses Tc (13.2%) also appears – meaning labor cost efficiency has a moderate impact on the model’s assessment.
In summary, RealRate’s model for construction firms is primarily driven by profitability and cost management metrics. Gross profit and operating profit margins are king. They overshadow other factors like minor balance sheet tweaks or inventory quirks. That said, the model doesn’t ignore those; it considers many variables (as evidenced by the network of boxes in Figure 7), but their contributions accumulate to less influence than the main profitability variables. The feature importance analysis tells industry players that to improve your RealRate ranking, improving core profitability (increasing gross and operating margins) will move the needle far more than, say, slightly reducing inventories or tweaking financing structure. It also tells observers that RealRate’s AI sees profitability as a key indicator of long-term solvency – a sensible conclusion, as consistently profitable companies can self-finance and reduce debt, raising their ECR.
Broader Market Statistics and Outlook
Financially, the German construction sector as assessed by RealRate is showing resilience but also polarization. Among the nine rated companies, the average ECR is 94% and the standard deviation of ECR is roughly 40 percentage points – a wide spread. This means while most firms hover near that 94% mark, a couple are drastically higher and a couple are drastically lower. It’s a sign of divergence: some firms (like the top 3) have set themselves far apart by deleveraging and reinforcing equity, whereas a few at the bottom remain heavily leveraged or have thin capital. The average change in ECR from the previous year appears to be a slight decline (the market average went from 107% last year to 94% this year in the adjusted sample). This could indicate either that overall, companies’ finances weakened a bit (possibly due to economic headwinds in 2024), or simply that the composition of the rated sample changed. Since RealRate’s model was updated, it’s recomputed all years – so this 13-point average drop likely reflects real financial changes such as higher costs, inflation impact on balance sheets, or new debt financing in 2024 for many firms. The industry faced rising material costs and interest rates in 2024, which can squeeze margins and increase debt, possibly explaining a general dip in ECRs.
Looking ahead, the combination of rising interest rates and cooling construction demand (due to economic cycles and possibly saturation in some building sectors) means companies with low ECR (heavier debt) might struggle. They’ll face higher borrowing costs and less buffer to absorb shocks. RealRate’s 2025 ranking has essentially put a spotlight on the firms best positioned to weather the storm. Ezel and Glöckle can sustain hits and still stand strong – a valuable trait in an industry often subject to volatility. Companies like Goldbeck with lower ECR will want to improve that metric, perhaps by cutting debt or raising fresh equity (for example, via bringing in new investors or retaining more profits going forward). The financial discipline shown by the top-ranked companies sets a benchmark for others.
In the broader economy, Germany’s construction sector in 2025 is navigating challenges like material cost inflation, skilled labor shortages, and shifting demand (e.g., more renovation, less new-build). The RealRate data implies that those who navigated 2024 well did so by controlling costs and maintaining a solid capital base. Going forward, we might expect some consolidation – weaker firms could become acquisition targets for the stronger ones, as financially robust companies can leverage their strength to grow market share. After all, a high ECR also typically means the company has borrowing capacity if needed and credibility with clients (a client knows a high-ECR builder is unlikely to go bankrupt mid-project!).
In conclusion, RealRate’s independent AI rating paints a reassuring picture for the top contenders in Germany’s construction arena. Financial strength is not solely about size – it’s about smart management, strong profits, and prudent balance sheets. The 2025 rankings showcase companies that exemplify these qualities. While a few notable names lag behind, the trend is clear: higher equity and sustainable profits are the winning formula in this industry. Stakeholders – from investors to clients – can take confidence in the leaders identified here, as these firms have proven resilient and efficient in a challenging environment. And for the industry at large, the analysis highlights where improvements can be made (boosting operational margins and equity levels) to build a more robust construction sector for the future.