U.S. petroleum companies in 2025 are led by firms with rock-solid balance sheets. An AI-driven ranking of 54 oil & gas firms reveals that those with minimal debt and high equity dominate the top spots, reflecting their superior financial health and resilience. The industry as a whole remains robust, with total annual revenues around $128 billion, assets of $442 billion, expenses of $115 billion, and stockholders’ equity of $303 billion (aggregate across all companies). These figures underscore a sector buoyed by strong earnings and asset bases. Yet, within this landscape, the gulf between the financially strongest and weakest companies is striking – the top performer boasts an economic capital ratio near 300%, while the weakest barely registers above 0%. Below, we explore the 2025 petroleum company rankings, the trends behind them, and what drives the leaders’ success in plain terms.
Ranking Highlights: Top 3 Companies and Big Movers
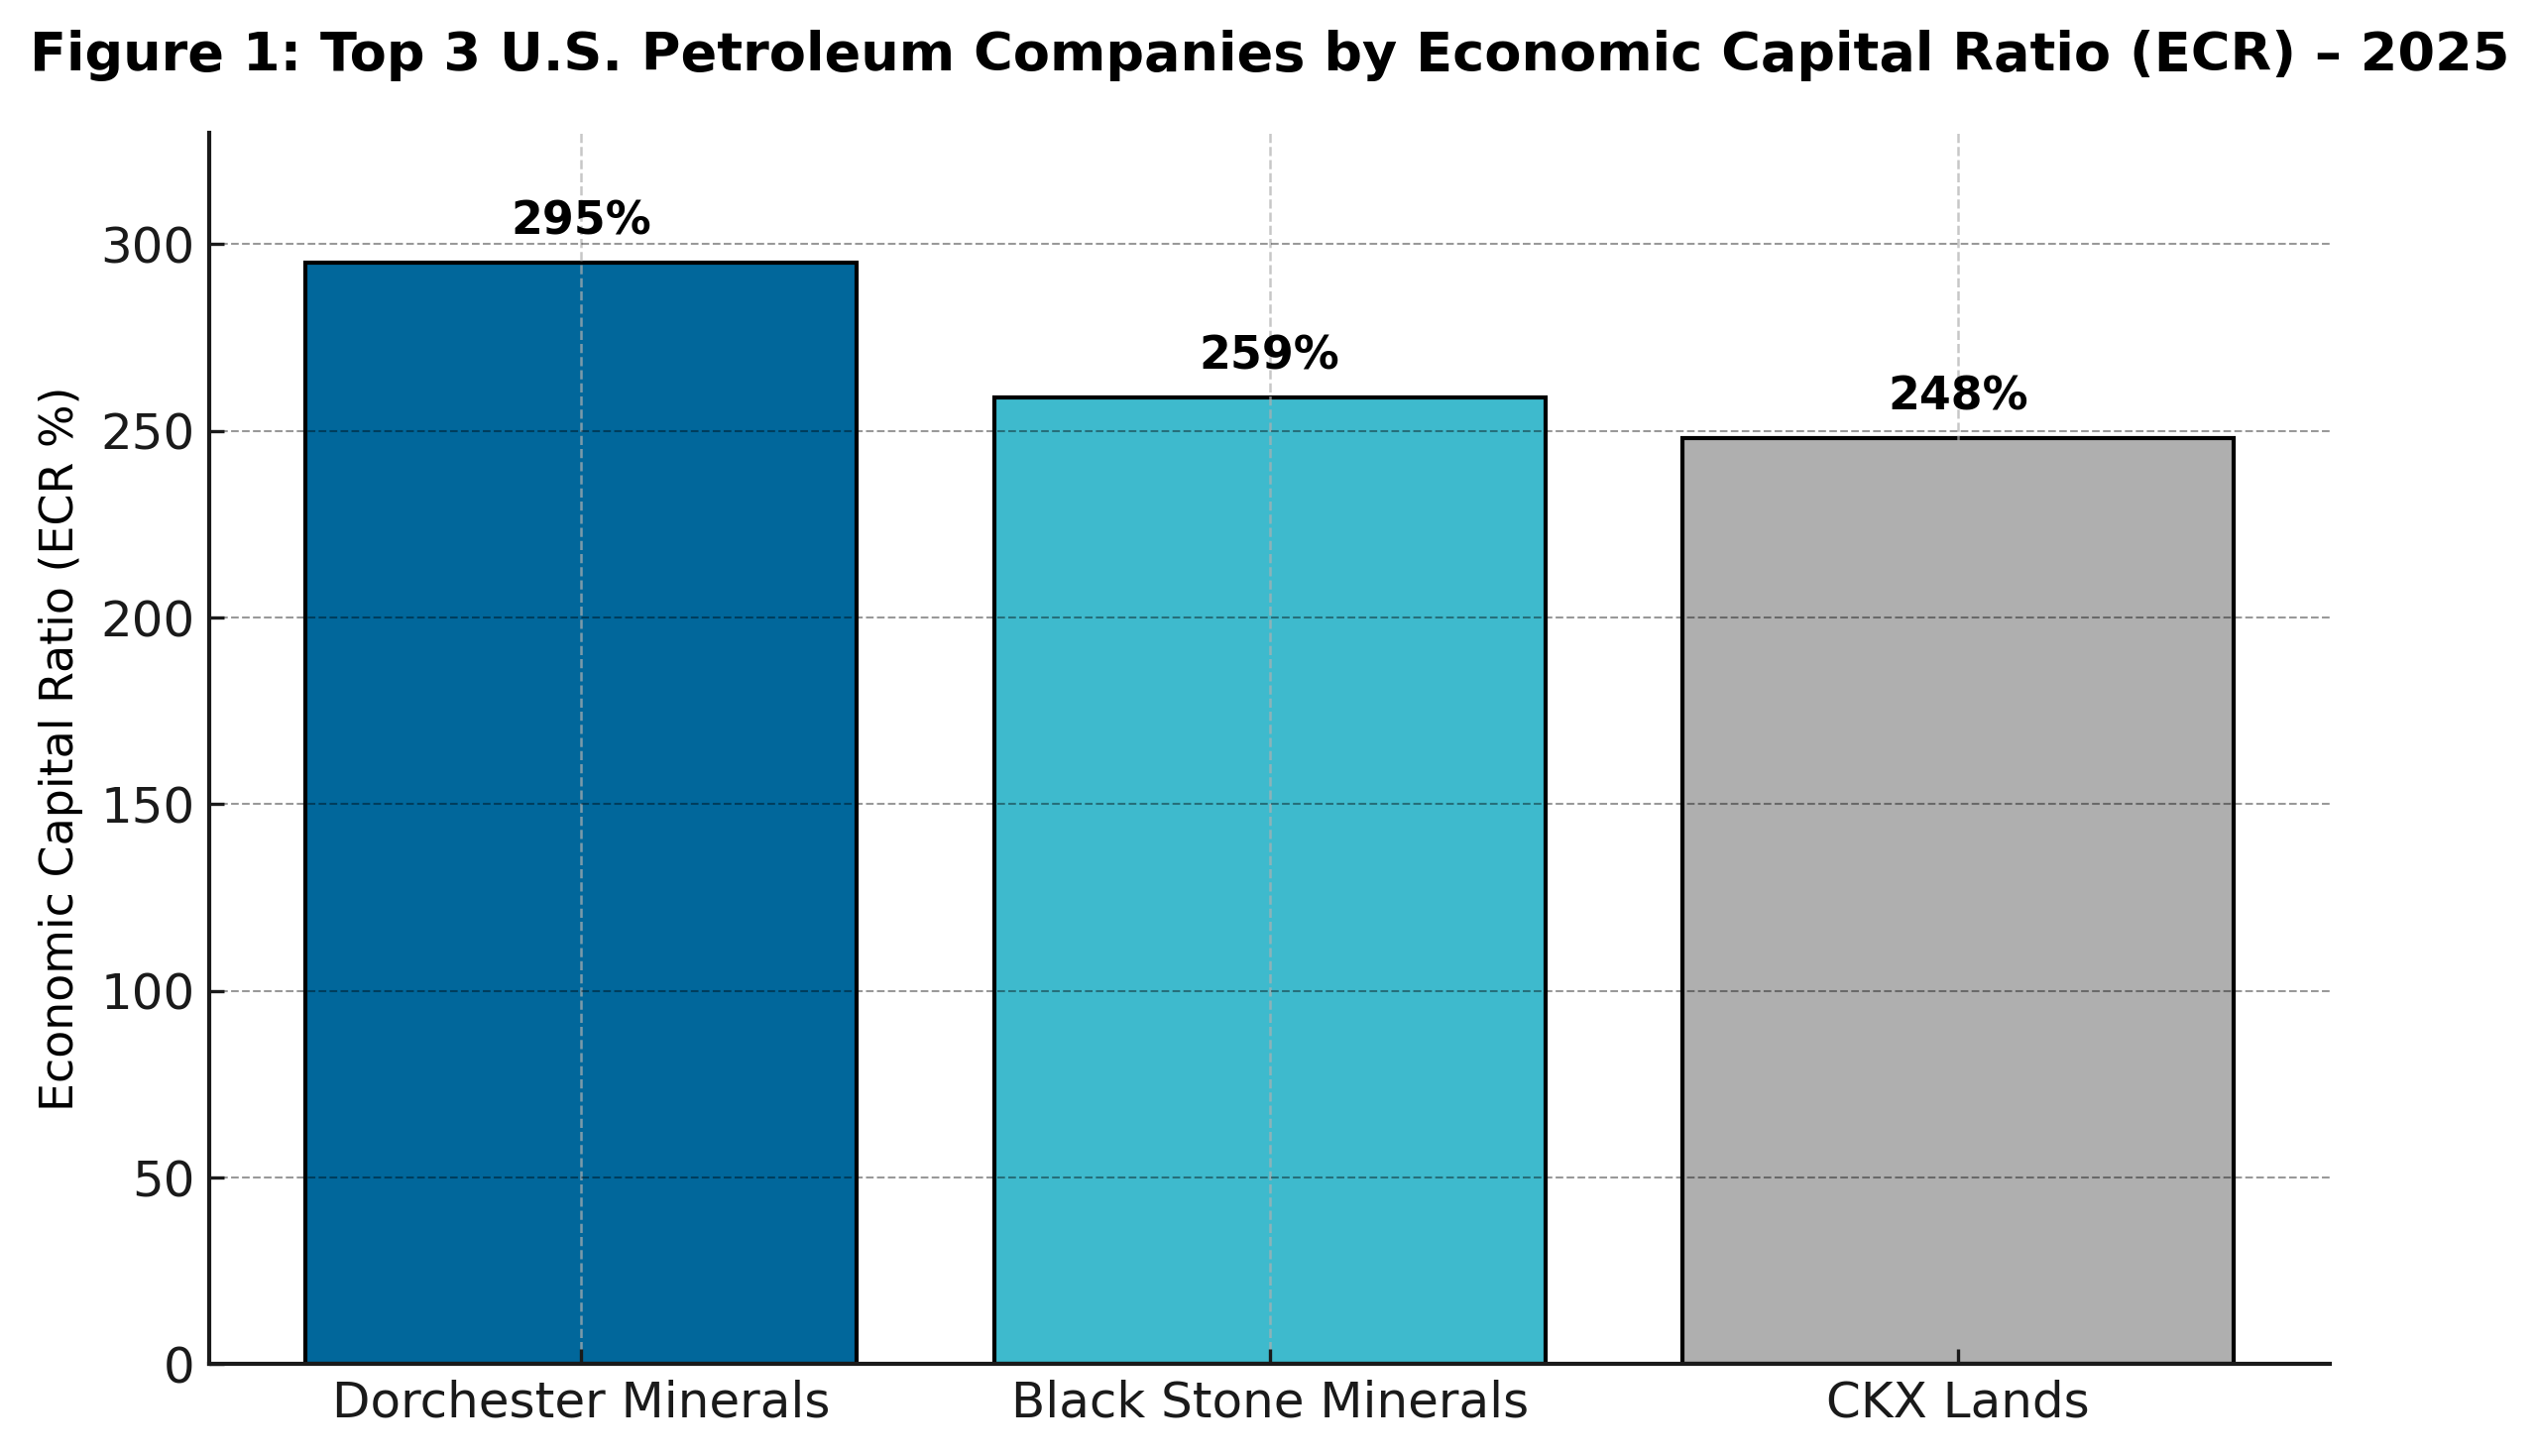
Figure 1: Top 3 companies by Economic Capital Ratio in 2025. Each bar shows the Economic Capital Ratio (financial strength) of the highest-ranked U.S. petroleum firms.
Dorchester Minerals, L.P. leads as the #1 “Top Rated” company with an Economic Capital Ratio (ECR) of ~295%, meaning its financial strength is nearly three times the industry average. Black Stone Minerals, L.P. follows at #2 (ECR ~259%), and CKX Lands, Inc. at #3 (ECR ~248%). These percentages indicate how much economic value (in effect, equity capital) each company holds relative to its total assets – higher is better. In practical terms, all three have very high equity and very low debt, making them exceptionally robust. They stand 125–172 percentage points above the average industry ECR of ~123%. By contrast, the bottom-ranked firms have ECRs near zero, reflecting heavy liabilities or minimal equity. The gap between best and worst is huge – the strongest company’s ratio (nearly 300%) vs. the weakest at virtually 0%.
Beyond the top three, notable shake-ups occurred in the 2025 rankings. Tianci International Inc. rocketed 49 places from 60th to 11th – an extraordinary leap attributed to its excellent revenues boosting its capital ratio. On the other end, Houston American Energy Corp. plummeted 31 spots from 18th to 49th due to high operating costs eroding its profit. A newcomer, EOG Resources, Inc., entered at rank 8, making it the highest-ranking new entrant, thanks to a strong balance sheet and profit surge. These swings illustrate how changes in income or expenses can dramatically impact a company’s financial strength ranking. High revenues propel companies upward, while heavy expenses or debt drag others down – a pattern clearly seen in Tianci’s rise and Houston American’s fall.
Financial Strength Trends Over Time
How have the top players’ standings evolved? Figure 2 tracks the top three companies’ ECR (financial strength) over the past five years.
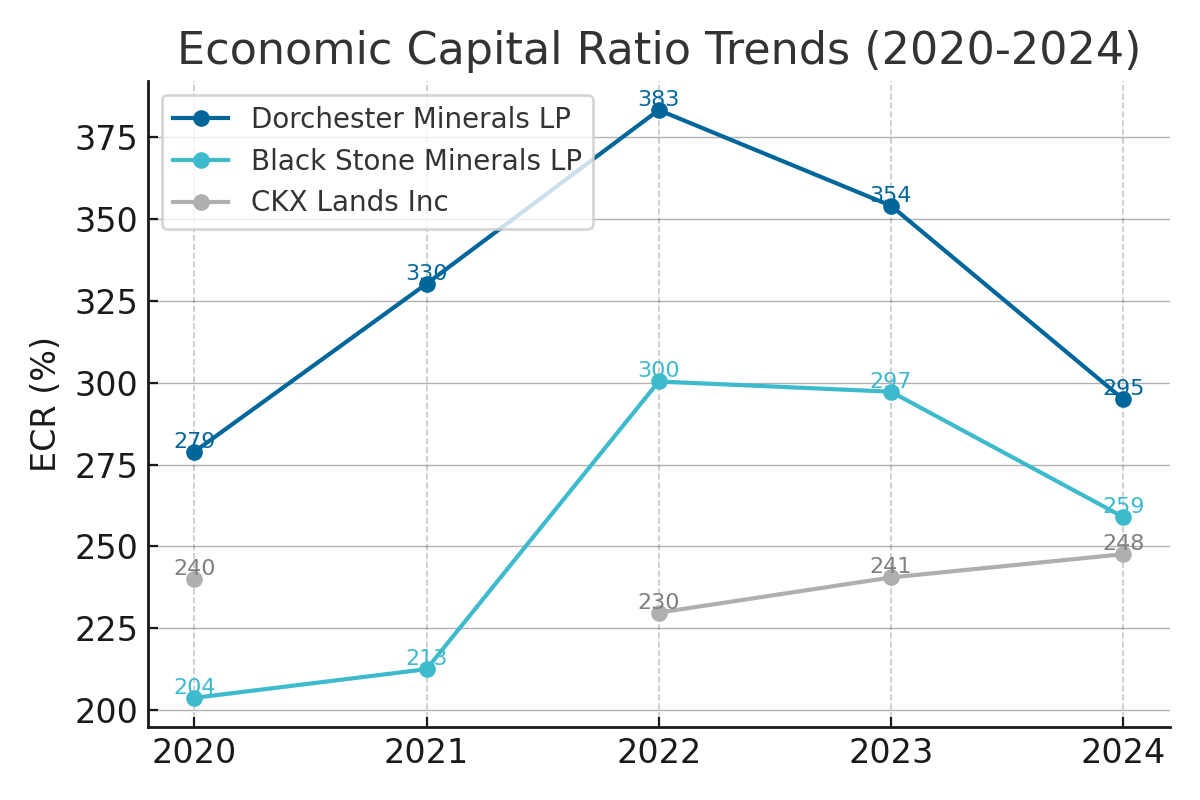
Figure 2: Economic Capital Ratio trends (2020–2024) for the top 3 companies. Higher ECR means greater financial strength. Dorchester (blue) re-entered at #1 in 2020 and remains dominant; Black Stone (teal) climbed steadily to #2 by 2022; CKX Lands (gray) dipped in 2021–2022 then rebounded to #3.
Dorchester Minerals has consistently been a top performer, with its ECR staying above ~280% in recent years. In 2022 it peaked at an astounding 383% – coinciding with strong profits and equity growth that year – before settling to 295% in 2024. Even with this pullback, Dorchester maintained the #1 rank from 2020 through 2025. Black Stone Minerals has shown a steady rise: its ECR grew from ~204% in 2020 to ~300% by 2022, lifting it from 7th place up to 2nd. It held the #2 spot through 2023 and 2024 with an ECR around 259% last year. CKX Lands has had a more tumultuous path. A top-three company in the mid-2010s, its rank slipped to 15th in 2022 amid stagnant assets and a lack of new income (it even disappeared from the 2021 list). However, CKX surged back to #3 in 2024 as its ECR recovered to ~248%. This small company’s strength remains its debt-free balance sheet – even with minimal revenue, CKX’s assets are nearly all equity, keeping its capital ratio high.
In summary, the long-term trend underscores that companies with consistently high equity and controlled liabilities stay on top. Dorchester’s slight dip in 2024 reflects industry volatility (oil price swings affecting asset valuations), yet it and its peers remain well above the pack. Meanwhile, previously mid-ranked firms like Black Stone have improved their finances (e.g. paying down debt, boosting profit) to climb into the top tier. The data over time reinforces a key point: financial strength is not static – prudent financial management can elevate a company’s standing, whereas rising costs or debt can knock even large players down a few pegs.
What Makes a Company “Strong”? Key Factors and Distribution
Financial strength in this rating is driven by two broad factors: balance sheet solidity (equity vs. debt) and profitability (income vs. expenses). RealRate’s Economic Capital Ratio essentially measures how much of a company’s assets are funded by shareholder value (equity) as opposed to liabilities, adjusted for earnings power. Higher equity (and profits) push the ratio up; high debt or big losses push it down[3]. Figure 3 illustrates how various financial features impact companies across the industry, with green indicating positive effects and red indicating negative effects on ECR.
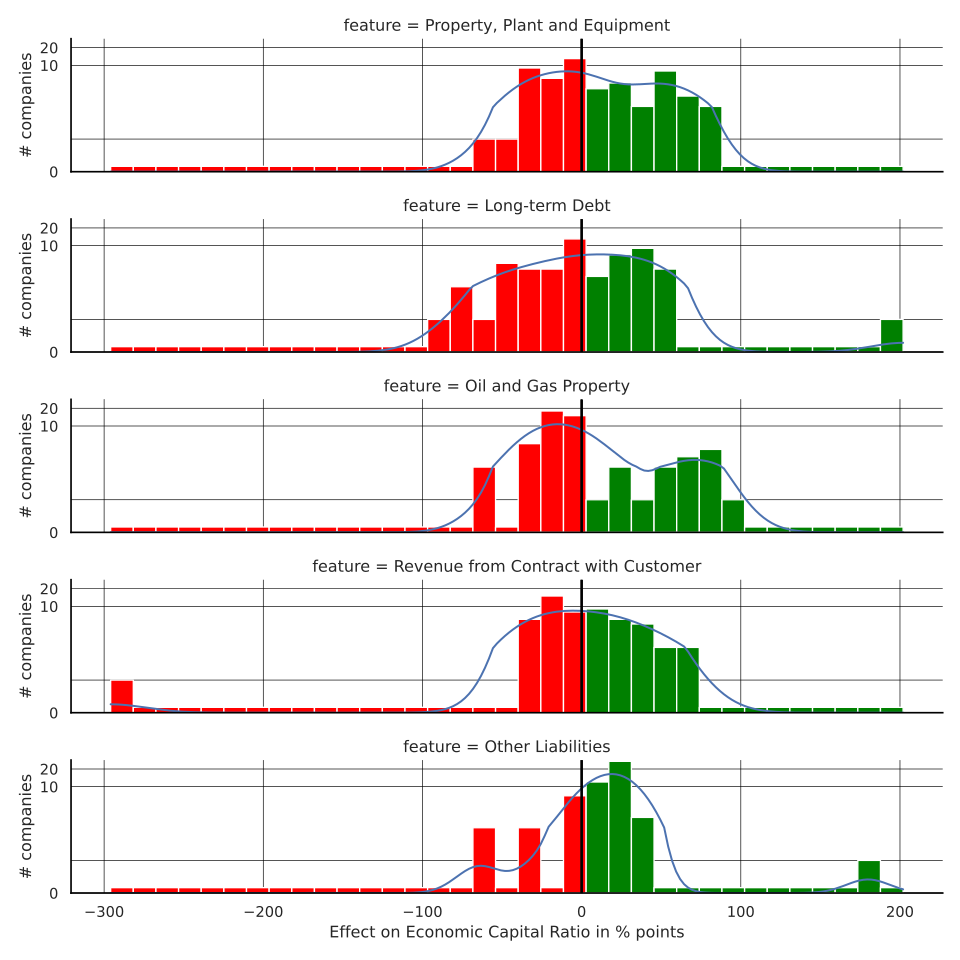
Figure 3: Distribution of feature effects on ECR for U.S. petroleum industry. Each panel shows a histogram of companies’ feature effect on ECR (in percentage points) for a given variable. Green bars = positive effect (above industry average), red bars = negative effect. The black arrow marks the average effect. Example: “Long-term Debt” has a distribution mostly in red (left of 0), meaning high debt usually hurts ECR.
From these distributions, we learn which financial metrics tend to help or hurt a company’s standing. Stockholders’ Equity (not shown as a panel, but essentially the inverse of liabilities) is the strongest positive driver – companies with equity far above the industry norm enjoy major boosts to their ECR. On the flip side, Long-term Debt has a predominantly negative effect (red) for most companies, confirming that heavier debt loads usually weaken financial strength. Oil and Gas Property (essentially the book value of oil & gas reserves and equipment) skews red for many firms – large investments here can drag down ECR unless matched by commensurate equity, perhaps because they represent assets that haven’t translated to earnings yet. Revenue from Contract with Customers shows a roughly even split: about half the companies have above-average revenue effect (green) and half below (red), by design (since effects are measured relative to an average). In practical terms, higher revenues help ECR (green bars to the right) by contributing to profits, but if a firm’s revenue is below the norm, it’s a drag (red left side). Other Liabilities (like provisions or deferred costs) unsurprisingly lean red as well – extra liabilities of any kind tend to harm the capital ratio.
Crucially, the wider a distribution, the more important that feature is in differentiating companies. We see that Property, Plant & Equipment and Long-term Debt have quite wide spreads (range of effects ~±100+ points), indicating they vary greatly between companies and strongly influence the ECR differences. Oil & Gas Property and Other Liabilities also show a broad impact range. Features with narrow distributions (e.g. perhaps certain expense categories not shown here) affect all companies similarly and thus don’t explain rank differences as much.
Most Influential Features: Equity is King
Which financial metrics matter most? The feature importance analysis, summarized in Figure 4, highlights the heavy hitters. At a glance, Stockholders’ Equity is by far the most influential factor in the model – in this industry it carries about a 77% importance weight. This makes sense: equity (assets minus liabilities) directly boosts the capital ratio. In contrast, Liabilities (especially long-term debt) also carry high importance (~50%) but with a negative impact: more debt can sharply reduce a company’s ranking. Other top factors include Oil and Gas Property (37%) and Operating Expenses (26%), reflecting that asset-heavy operations and high costs can significantly shape financial health. Revenues (around 17%) and Net Income (~20%) have slightly lower individual importance, but collectively, income-related factors are vital – strong earnings feed into equity growth over time. Meanwhile, niche or minor line items (like “Deferred Tax Liabilities” at ~12%, or “Other Expenses” ~12%) have smaller effects individually.
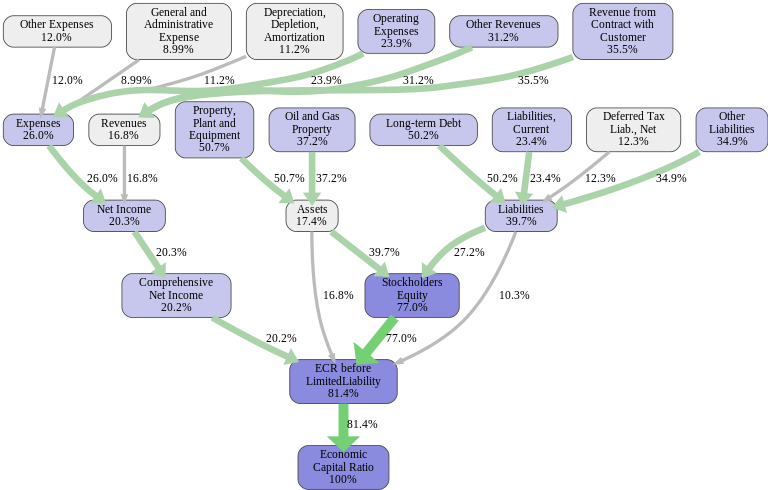
Figure 4: Feature importance graph for the U.S. petroleum industry. Each node is a financial variable; percentages indicate its relative importance in explaining companies’ ECR. Green arrows denote positive correlations (e.g. Equity 77.0% is very positive), red arrows negative (e.g. Expenses 26.0% detract from ECR). Bottom node is Economic Capital Ratio (100% total). Stockholders’ Equity and Long-term Debt clearly dominate the model.
In plain language, Figure 4’s takeaway is: balance sheet strength (high equity, low debt) far outweighs everything else in determining who comes out on top. Profitability measures (revenues vs. expenses) are important but secondary – they feed into net income and equity over time. The model confirms that an oil company can have sizeable revenues, but if those revenues don’t translate into retained equity (due to high costs or payouts), the company won’t rank near the top. Conversely, a firm with modest sales but extremely low liabilities (like CKX Lands) can punch above its weight in financial strength.
Inside the Top Companies: Why They Excel
Let’s delve into the profiles of the top 3 companies to see why they did so well and how they differ. Each of these firms enjoys exceptional financial health, but for slightly different reasons:
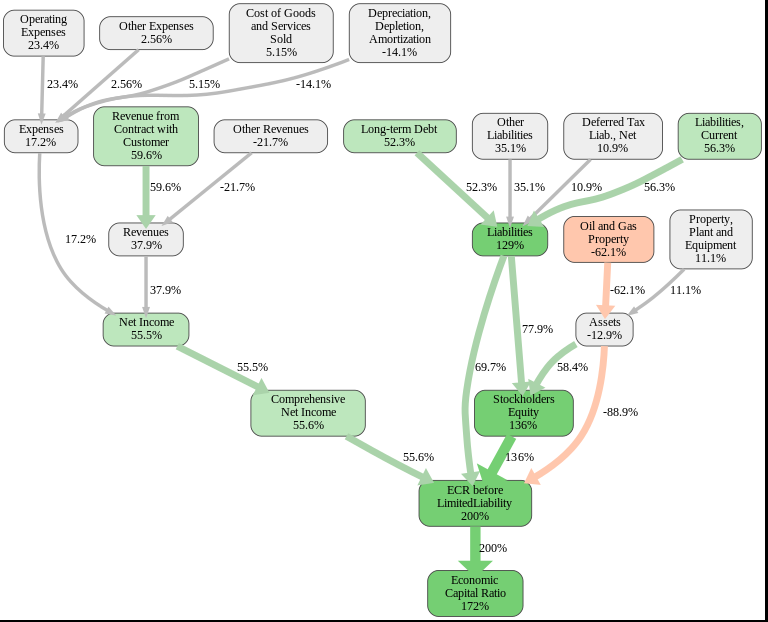
- Dorchester Minerals, L.P. (Rank 1) – A royalty and mineral interests company, Dorchester has virtually no debt on its books (only ~$0.8 million long-term debt against $367 million in assets) This means almost all of its assets are funded by equity – a major strength. In 2024, Dorchester’s stockholders’ equity was about $362 million, which is 136 percentage points higher than the industry average equity level when scaled to assets. This single factor boosts its ECR by +136% points, the largest positive effect among all features[3]. Dorchester is also highly profitable: with revenues of $161.5 million and net income of $92.4 million in the latest year, it converted well over half of its revenue into profit – indicating very efficient operations or high-margin royalty income. This strong profit further bolsters its equity (retained earnings), contributing an additional ~55% positive effect. Dorchester’s only notable weakness is its large assets in “Oil and Gas Property” (valued around $298 million). Relative to the industry, Dorchester holds more in oil/gas reserves, which the model viewed as –62% points drag on its ECR In essence, Dorchester’s huge equity far outweighs this slight negative: it’s as if the company’s strong balance sheet adds +136 points to its score while its heavy assets subtract 62, still leaving it deep in positive territory. Little wonder it tops the ranking.Figure 5: Cause-and-effect diagram for Dorchester Minerals, L.P. (Rank 1). Green boxes/arrows = positive influences; red = negative. Dorchester’s Stockholders’ Equity (+136%) and ongoing profits are enormous positives (thick green arrows), easily offsetting the Oil and Gas Property asset (−62%) effect (orange arrow). Its Economic Capital Ratio of ~295% is 172 points above the market average.
- Black Stone Minerals, L.P. (Rank 2) – Another mineral and royalty interest firm, Black Stone is larger in scale but similarly equity-rich. Its total assets of about $1.219 billion are 93% funded by equity ($1.129 billion equity), leaving a relatively small ~$89 million in liabilities. Like Dorchester, Black Stone’s equity base is about 120% points above average, giving it a huge head start in ECR. Black Stone also benefits from healthy operating profitability – $433.7 million in revenue produced $271.3 million in net income in the recent year. That strong profit (net income effect +46.6%) adds to its equity cushion. Black Stone’s weakest area is “Other Revenues” (essentially, it has no additional miscellaneous revenue streams beyond its core royalties). The model tags this as a –19% point effect, meaning the company doesn’t get a boost from any diversified income. However, this “weakness” is minor – having no extra revenue is not a big problem when core earnings are solid. Overall, Black Stone’s ECR of ~259% is 136 points above the market average, closely trailing Dorchester. In short, Black Stone secured the #2 spot through the same recipe of high equity, moderate debt, and strong profits, with negligible weaknesses.
- CKX Lands, Inc. (Rank 3) – The story of CKX Lands is unique due to its small size. With just $18.8 million in assets, CKX is a tiny Louisiana-based land management company. Its financial strength, however, is mighty: CKX carries zero long-term debt and only ~$0.26 million in current liabilities. Virtually all of its assets are shareholders’ equity (~$18.6 million). The model identifies Stockholders’ Equity as CKX’s greatest strength, giving a whopping +165% point effect – the highest of any company’s strength factor. This means CKX’s equity ratio is far above the norm (indeed, few companies are 98% equity-funded like CKX). That huge positive more than compensates for CKX’s glaring weakness: it generates very little operating revenue. In fact, CKX had $0 recorded “Revenue from Contract with Customer” in the recent period (its $1.535 million total revenue was classified as “Other Revenues”). The model sees this lack of customer revenue as a –20% point hit to ECR. But since CKX also has minimal expenses (it earned a net income of only $0.25 million, but also has negligible costs), it remains strongly cash-positive. In effect, CKX is an example of a company that earns little, but spends little and owes nothing – its financial strength derives purely from its debt-free asset base. That was enough to propel it back into the top 3. CKX’s ECR of ~248% stands about 125 points above average, proving that in this ranking, lean and debt-free can beat big and leveraged.
It’s worth noting that all three top companies are structured as partnerships or have unique business models (royalty trusts or land holding firms) that inherently carry low leverage. They don’t need to borrow much because their operating model either generates steady income (royalties) or requires low overhead (land management). This highlights a broader insight: the petroleum firms with conservative finances outshine those chasing growth via heavy debt. For example, many larger oil producers or refiners, which invest in massive projects using borrowed funds, rank lower in the list. Even oil giants can fall behind if they carry comparatively higher debt or slimmer equity cushions – as reflected by mid-pack rankings of some well-known names.
Consistency of Strengths and Weaknesses Over Time
To further illustrate what drives a top company, consider Dorchester’s strengths vs. weaknesses over the past decade. Figure 6 charts the effect of its biggest strength (equity, green line) and biggest weakness (oil & gas assets, red line) each year since 2011.
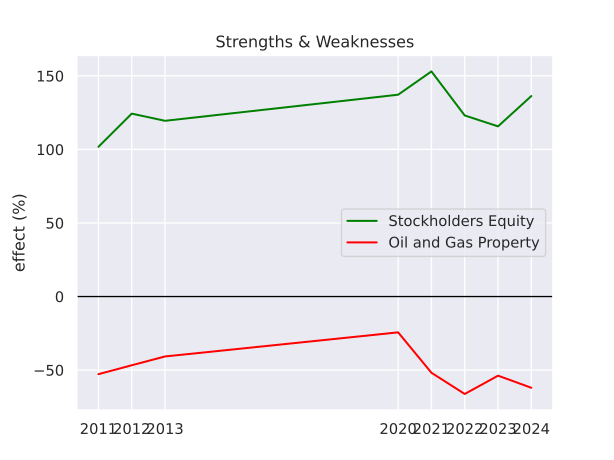
Figure 6: Dorchester Minerals – Strength (Stockholders’ Equity) and Weakness (Oil & Gas Property) effects over time. Green line shows how many % points Dorchester’s equity added to its ECR each year; red line shows points subtracted by its oil & gas assets. Dorchester’s equity effect has stayed extremely high (100–150+ points) and rising, while its asset drag (red) grew to about –80 points in 2021–2022 then eased to – Fifty-something points in 2024.
This history reveals that Dorchester’s financial dominance has been equity-driven throughout. Its equity advantage over peers was already ~110 percentage points in 2011, and grew to a peak of ~155 points by 2021. Even as industry averages shifted, Dorchester’s equity remained a massive outlier on the positive side. Meanwhile, the negative effect from its oil/gas assets was around –40 to –60 points for much of the 2010s, worsening to –88.9 points at one stage (likely when Dorchester acquired more reserves in 2022), before improving slightly after 2023 (perhaps due to revaluation or production of those assets). The key point is that Dorchester’s strength consistently outweighed its weakness by a wide margin every single year – a green line well above the red line – which kept it at or near the top of the rankings whenever it was included. Other firms show similar patterns: Black Stone’s strength (equity +120 points) dwarfs its mild weaknesses, and CKX’s strength (+165) hugely outstrips its revenue gap (–20). Consistency in these fundamental factors is why these companies have stayed on top. It isn’t luck or one-off events – it’s baked into their financial structure.
Market Validation: Do Stock Prices Reflect These Strengths?
Interestingly, the RealRate model’s results align with market valuations. The regression plot of predicted vs. actual market capitalization for these companies shows a strong positive correlation. In other words, companies that score well in this financial strength rating also tend to have higher stock prices and market values. This suggests that investors reward the same traits – low debt, high equity, solid profits – with higher valuations. The model effectively captures real financial health, not just theoretical metrics. For example, Dorchester Minerals and Black Stone Minerals have seen their stock prices appreciate over the past year, reflecting investor confidence in their sustainable royalties and fat balance sheets. On the other hand, a debt-laden company dropping in rank often coincides with market skepticism and a lagging share price. The positive correlation noted in the analysis indicates that financial strength as measured here goes hand-in-hand with market success, reinforcing the credibility of these rankings.
Conclusion: Safety First Pays Off in Oil & Gas
The 2025 petroleum industry ratings underscore a clear lesson: fiscal prudence and efficiency win the day. Companies that kept debt to a minimum and maintained strong equity bases – often through steady profits and disciplined spending – have risen to the top. The likes of Dorchester and Black Stone exemplify how conservative financial management yields superior resilience, enabling them to weather oil price swings and sector volatility better than peers. Meanwhile, firms that over-leveraged or allowed costs to balloon are further down the list, even if their revenues are large.
It’s a classic tortoise-and-hare scenario playing out in oil & gas finance. The “slow and steady” tortoises with solid balance sheets now lead the race, whereas some hares that aggressively expanded with debt have fallen behind. As the data shows, the average ECR across the industry is about 123% – meaning the typical company’s asset base is just barely higher than its liabilities – but the standard deviation is high, and the top performers far exceed that benchmark. This dispersion indicates significant risk differences: a company at 295% is extraordinarily safe (ample assets backing every dollar of obligation), whereas one at 0–10% is on shaky ground.
In an industry as cyclical as petroleum, such financial strength can be the difference between thriving and merely surviving. The 2025 rankings highlight those who are thriving. Investors and stakeholders can take heart that the top-rated companies are built to last, providing a measure of stability in a sector known for booms and busts. And for the companies themselves, the takeaway is straightforward – in the long run, sound finances and operational discipline are rewarded, both in these ratings and by the market. The era of growth-at-all-costs has given way to a focus on sustainability and strength, and the companies at the top of the RealRate list are leading by example.