How Gold Funds Took the Lead in 2025 – Financial Strength Rankings Unveiled
The US Brokers industry – encompassing major investment firms, exchanges, and commodity funds – has demonstrated remarkable financial performance recently. In 2025, RealRate’s artificial intelligence model updated the rankings of 42 U.S. broker companies by Economic Capital Ratio (ECR), a measure of economic value relative to total assets. The results reveal a surprising shake-up: niche commodity trusts now lead the pack, buoyed by extraordinary profits, while traditional brokers scramble to keep up. Below, we explore the key winners, their strengths and weaknesses, and broader industry trends through clear charts and an accessible analysis.
Industry Snapshot: Size and Performance
The U.S. Brokers industry is huge, comprising everything from Wall Street giants to specialized funds. In total, these 42 companies manage about $2.52 trillion in assets and generate roughly $210 billion in annual revenues, against $191 billion in expenses. They collectively hold about $392 billion in equity capital. This translates to an average ECR of around 138% – meaning the typical firm’s economic value is 1.38 times its assets – a solid improvement from the prior year. Such figures indicate a generally healthy sector, though variations among individual companies are significant. The standard deviation of ECR is about 74 percentage points, reflecting a wide gap between the strongest and weakest players. In 2025 especially, commodity price movements created big winners and losers, elevating the industry’s median financial strength after a volatile few years.
Top Three Financial Winners of 2025
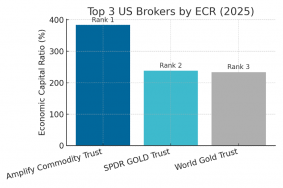
Figure 1: Top 3 US Brokers by ECR (2025). The bar chart shows the Economic Capital Ratio for the three highest-ranked companies. Amplify Commodity Trust leads with an ECR of 383%, followed by SPDR Gold Trust at 238% and World Gold Trust at 234%. Each bar is labeled with the company’s rank.
RealRate’s latest rating update crowned Amplify Commodity Trust as the #1 broker in financial strength for 2025, with a staggering ECR of 383%. In second place is the SPDR GOLD Trust at 238% ECR, and close behind in third is World Gold Trust at 234% ECR. These values (illustrated in Figure 1) mean that, according to RealRate’s AI model, the economic value of each of these companies is well over double their total asset base – a truly remarkable level of capital robustness. For context, an ECR of 100% would indicate a company’s economic value equals its assets; these leaders far exceed that benchmark.
All three top performers are commodity-focused funds rather than traditional brokerage firms. Amplify Commodity Trust is known for its Breakwave Dry Bulk Shipping ETF (BDRY), which profits from shipping freight futures. SPDR Gold Trust (ticker: GLD) and World Gold Trust are major gold-backed exchange-traded funds, holding vast quantities of precious metal. Their ascension to the top reflects how booming commodity markets and clever financial structures have fortified their balance sheets. Amplify’s ECR of 383% is the highest ever recorded in this RealRate category, signaling extraordinary financial strength.
Notably, this is a big change from previous years. In prior rankings, large broker-dealers and investment banks often dominated the top spots. Now, however, specialized commodity trusts have overtaken them. This suggests that 2024’s market conditions – such as surging shipping rates and rising gold prices – massively boosted the economic capital of these funds relative to their size. Meanwhile, some traditional brokers fell behind due to slimmer margins or higher risks.
A Dramatic Rise for Commodity Trusts
How did these companies climb so high? The journey of the top 3 over recent years has been dramatic, as shown in Figure 2 below. It plots each company’s ECR and rank from 2019 through 2024, highlighting their meteoric rise:
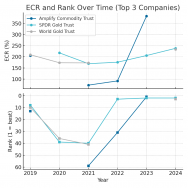
Figure 2: ECR and Rank Over Time (Top 3 Companies). The upper panel shows Economic Capital Ratio (%) for Amplify (dark blue), SPDR Gold (teal), and World Gold (grey) from 2019 to 2024. The lower panel shows their ranking positions (1 = best) over the same period. Gaps indicate years where a company was not in the ranking or had no data.
Amplify Commodity Trust’s trajectory is most striking. Five years ago, Amplify was a mid-tier entrant (in 2019 it was ranked around #13 with a solid 205% ECR). By 2021, it had slipped to rank 59 as shipping markets cooled. But then came a spectacular turnaround. In 2022, Amplify jumped to rank 31, and by 2024’s analysis it rocketed all the way to rank 1. Its ECR skyrocketed from a modest ~92% in 2022 to 383% by 2024 (see dark blue line in Figure 2). This 30-rank leap in a single year is the largest move in the industry – reflecting a windfall in Amplify’s comprehensive income (more on that shortly). Essentially, Amplify’s fortunes were transformed by booming dry bulk freight rates, which greatly increased the value of its niche investments.
The SPDR Gold Trust, a much larger and older fund, had a steadier yet significant climb. It hovered in the top 10 in 2019, then faced a tougher 2020–21 (its ECR dipped amid market turmoil, and it fell to 40th place at one point). But as gold prices rallied and it maintained low liabilities, SPDR’s ranking improved sharply. It jumped to #3 in 2022 and then #2 in 2023, where it remains. The teal line in Figure 2 shows SPDR’s ECR rising from ~169% in 2021 up to ~238% currently. Its rank improved from the 40s to single digits – a testament to how a stable, asset-heavy trust can weather storms and benefit when its core asset (gold) gains value.
World Gold Trust’s story is a bit different. It wasn’t even ranked in 2022 or 2023 (having dropped out of consideration perhaps due to a restructuring or late financial data). But it returned with a splash. In the latest 2025 ranking, World Gold Trust debuted at #3, instantly becoming the “best newcomer” of the year. As the grey line in Figure 2 suggests, World Gold Trust had respectable ECRs around 170–210% in 2019–2021 but then vanished (likely due to not meeting some criteria or zero rankings in those years). Now it reappeared with an ECR of 234%, securing rank 3. Its re-entry underscores that new or previously overlooked entities can rise quickly if conditions favor them – in this case, benefitting from a gold boom and solid finances.
Meanwhile, many conventional brokerages have seen their relative strength slip in comparison. Well-known names like Morgan Stanley, Charles Schwab, and Jefferies Financial are much lower on the list, with ECRs between ~55% and 90%. They remain profitable, but their massive asset bases and expenses keep their ECRs more modest. Smaller specialty firms are also scattered through the middle of the pack. None could match the outsized gains of the commodity trusts this year.
Beyond the top three, a few other notable movers include Global Macro Trust (up 16 places to rank 9) and Nestor Partners (up 12 places to rank 8), both hedge-fund-like partnerships that rebounded strongly. On the downside, Altegris Winton Futures Fund fell from rank 7 to 13, hurt by poor revenue performance, and a few long-established brokers stagnated in the lower ranks. Impressively, only four companies had negative ECRs (indicating more liabilities than assets’ value), and they remain outliers.
Overall, 2025’s ranking tells a classic financial story: when the tide of market fortune comes in, agile boats rise fast. Amplify and the gold trusts caught big waves, and as a result, they now tower over an industry where stability is common but spectacular gains are rare.
Why the Winners Did So Well: Strengths and Weaknesses
RealRate’s AI rating doesn’t just spit out a number – it analyzes dozens of financial variables for each company, identifying which factors help or hurt the final ECR. By examining the strengths and weaknesses of the top 3 companies, we can understand exactly how they achieved such high economic capital.
Each company’s profile can be visualized as a network of effects, as shown in the figures below. Green boxes indicate positive contributions to ECR, red/orange boxes indicate negative effects, and arrows show how financial inputs flow into the final outcome. Let’s break down each:
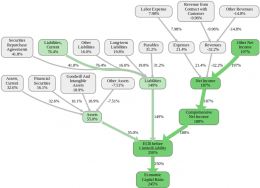
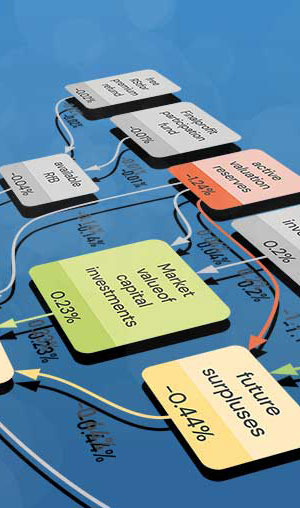
Figure 3: Amplify Commodity Trust – Key Factor Contributions. This cause-and-effect diagram (from RealRate’s model) shows Amplify’s financial variables and their impact on its ECR. Green nodes denote above-average strengths (boosting ECR), while red denotes weaknesses (lowering ECR). Line thickness indicates magnitude of effect.
Amplify Commodity Trust (Rank 1) stands out for an extraordinary strength: “Other Net Income,” which boosted its ECR by a whopping +197 percentage points (see the bright green node on the right of Figure 3). This category includes non-traditional income – in Amplify’s case, huge gains from its freight futures investments. Essentially, Amplify earned nearly $49.5 million in other net income (in 2024), which is more than its entire asset base of $42.5 million! This windfall profit is what drove Amplify’s ECR to stratospheric levels. The model identifies it as the greatest strength compared to industry averages. The Net Income node is correspondingly high (187% effect), as Amplify’s overall profits were stellar.
Amplify’s second major strength is its minimal liabilities. It has virtually no debt – Liabilities contribute +149% to ECR – and healthy equity. The chart shows thick green arrows flowing from low liabilities to a strong capital ratio. Amplify’s Stockholders’ Equity is about $41.2 million, very close to its asset total (meaning it’s almost entirely equity-financed, which the model favors heavily).
What about weaknesses? Amplify’s Achilles’ heel is a lack of traditional revenue. The model flagged “Revenues” (and specifically, revenue from customers) as a -32% drag on ECR (red boxes in Figure 3). Unlike many brokers, Amplify doesn’t earn significant fee or commission income – in fact, it reported zero operating revenue. In RealRate’s peer comparison, having no revenue is far below average, so it counts as a relative weakness. Another small negative is its Other Assets category (-7.5%), but this is minor. Essentially, Amplify is a unique creature: it forgoes normal revenue streams but more than makes up for it with outsized investment gains (other net income). The result is a sky-high ECR, but one achieved in an unconventional way.
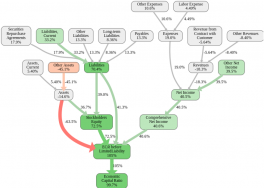
Figure 4: SPDR Gold Trust – Key Factor Contributions. The diagram highlights SPDR’s top positive factor (Stockholders’ Equity +73%) and top negative factor (Other Assets –45%), among others. Green arrows indicate contributions above industry norm; the red arrow shows a significant detractor.
Turning to the SPDR Gold Trust (Rank 2), the picture is a bit different. SPDR’s greatest strength is its enormous Stockholders’ Equity, which adds +73 percentage points to its ECR (Figure 4, bright green arrow). This makes sense – SPDR is structured as a trust that holds nearly all assets in gold for its shareholders. It carries minimal debt. In numbers, SPDR’s assets are about $73.7 billion worth of gold, and its equity (assets minus tiny liabilities) is $73.7 billion as well. Such an equity-heavy balance sheet is far stronger than the typical broker, so the model rewards it. Essentially, SPDR’s leverage is almost zero – a clear positive for stability.
Another strength is SPDR’s decent profitability: it had about $20.4 billion in net income (mostly from the rising gold value), which contributes around +40% to ECR. Comprehensive Net Income (including unrealized gains) added about +40.6%. SPDR also benefits from having low “Other Liabilities” and current liabilities (only ~$23 million in minor payables), which collectively improve ECR by about +39%.
The biggest weakness for SPDR Gold Trust, interestingly, is its heavy concentration in “Other Assets” – essentially the gold holdings themselves are classified differently than typical financial assets. The model labels Other Assets as a -45% effect (orange-red in Figure 4). This suggests that relative to an average broker (which might have a mix of loans, securities, etc.), having most assets in one bucket (gold) is viewed as a risk or simply a deviation that in industry-relative terms appears negative. We can interpret this as the downside of a single-commodity focus: while gold’s rise helped income, the holdings are less diversified and so count as a relative negative factor. Additionally, SPDR does have operating expenses (about $242 million in fees), and no operating revenue, which creates a modest drag (shown by the -18% from Revenues, -8% from Other Revenues, and -10.6% from Expenses). However, these are small in percentage terms given the gigantic asset base.
In summary, SPDR Gold Trust succeeds by being essentially all equity (no debt) and riding gold’s appreciation, but is slightly penalized by the model for being all-in on “other assets” (gold) and for not generating conventional revenue. The net effect still yields a superb 238% ECR.

Figure 5: World Gold Trust – Key Factor Contributions. Similar to SPDR, World Gold Trust shows a big positive from Stockholders’ Equity (+71%) and a negative from Other Assets (–42%), reflecting its gold-heavy balance sheet. Low liabilities and strong net income also bolster its ECR.
World Gold Trust (Rank 3) shares many characteristics with SPDR, albeit at a smaller scale (Figure 5). Its Stockholders’ Equity is extremely high relative to assets (+71% effect). World Gold Trust’s assets are about $9.16 billion (mostly gold), and equity is $9.108 billion, meaning negligible debt – the trust is ~99.5% equity-financed. That financial strength is far above the norm, hence the major green boost. World Gold also had a net income of $2.423 billion (again, due to gold price gains), which pushes ECR up by ~38%. As with SPDR, virtually all positives in the chart (green arrows) stem from what it doesn’t have: debt, loans, or risky liabilities. Its Liabilities are only $52 million, adding +37% to ECR simply by being so low.
On the flip side, Other Assets (the gold holdings) are once more a drag, at -42% effect (red arrow in Figure 5). World Gold Trust holds its $9+ billion of gold as “other assets,” so relative to an average broker it looks asset-heavy in a category not normally so large – again flagged as a weakness by the model. Like SPDR, it lacks traditional revenue (hence a -18% from Revenues) and has some minor expenses (management fees around $7 million). These negatives are quite small compared to the huge equity and net income positives.
In essence, World Gold Trust’s formula is: no debt, lots of gold, and gains from gold = high ECR. Its weaknesses mirror SPDR’s: concentration and absence of diversified revenue. But in a year when gold surged, those weaknesses did not stop it from achieving a 234% ECR, about 95 percentage points above the industry average.
In summary, all three top companies exemplify financial strength through high equity and big profits. Amplify did it via a speculative but lucrative strategy (freight futures profit), while the gold trusts did it via safe balance sheets and benefiting from gold’s rise. Their main weaknesses are structural (no regular revenues, unconventional asset mixes), but clearly, in 2025 those were not nearly enough to drag them down.
By the Numbers: Balance Sheets and Income of the Top 3
It’s worth peering into the financial statements to see how these factors manifest in dollars. According to the 2024 reports (for the year ending 2024):
- Amplify Commodity Trust has total assets of only $42.5 million, virtually all invested in commodity derivatives (classified under “Other Assets”). It carries a mere $1.3 million in liabilities. Its expenses were about $3.0 million (perhaps management fees), and notably it reported $0 revenue from typical operations. However, Amplify’s net income was $46.45 million, entirely driven by that “other net income” of $49+ million from its investments. This incredible profit boosted its comprehensive income and equity. Amplify’s equity now stands at $41.2 million, up from virtually nothing a few years prior, illustrating how its gains directly translated into capital.
- SPDR Gold Trust, in contrast, is massive. It holds $73.727 billion in assets (roughly 1,300 tonnes of gold bullion!). Its liabilities are just $23.5 million, mainly accrued fees. SPDR actually does have one revenue-like stream: it earned $242 million in “Commissions and Advisory Fees” (likely the creation/redemption fees or sponsor’s cut). But that is counted as an expense in the trust structure. SPDR’s expenses total $242 million, and it has no traditional sales revenue beyond the gold’s appreciation. The trust’s net income was about $20.36 billion, reflecting the increase in gold value over the year. With nearly all earnings retained (the trust doesn’t pay dividends like a stock), its equity equals assets minus tiny liabilities, at $73.704 billion. In other words, SPDR’s balance sheet is 99.97% equity-funded – a key reason it ranks so highly in financial strength.
- World Gold Trust is smaller but similar. It shows $9.161 billion in assets (gold holdings), offset by $52.9 million in liabilities. It had a small fee expense of $7.0 million and no operating revenue. Its net income was $2.423 billion, again due to gold prices. Consequently, its stockholders’ equity grew to $9.108 billion. That’s 99.4% of its assets financed by equity, only 0.6% by liabilities – an extraordinarily conservative capital structure. This is why World Gold Trust, though not huge, punches above its weight in ECR.
To put these in perspective, a traditional brokerage might have, say, 10% equity, 90% liabilities (borrowings, client payables, etc.), and rely on steady fees and interest for income. These three are the opposite – virtually no leverage, and incomes swinging on market values. In 2024, this approach clearly paid off.
Market Trends: Financial Strength Distribution and Outlook
The surge of these commodity funds also influenced the overall distribution of financial strength in the broker industry. RealRate’s Feature Distribution Plot (not shown here for brevity) illustrates that for each key financial variable, about half the companies have a positive effect (shown in green) and half negative (red) relative to the market average. For example, roughly half of the brokers have above-average equity ratios (helping ECR) and half have below-average equity (hurting ECR). Because our top 3 are extreme outliers in equity and income, they widen the spread: the 90th percentile ECR jumped to around 200%+, whereas the 10th percentile remains near 55%.
The RealRate Industry Index confirms that 2024 was a bounce-back year. Median ECR rose to about 141%, up sharply from ~116% the previous year. This median had dipped significantly in 2020 (around 104%) during the pandemic market shock, but has since recovered and now even exceeds pre-pandemic highs. The interquartile range also expanded, meaning the gap between strong and weak firms grew – again, thanks to a few stellar performers pulling ahead. All this suggests a healthy but uneven landscape: most brokers are financially solid, and some are extraordinarily so.
Looking ahead, a key question is whether these commodity-fueled gains are sustainable. Gold and shipping rates can just as easily reverse, which could normalize these trusts’ ECRs in future years. Traditional brokers, on the other hand, tend to be steadier; they could regain top spots if commodity markets cool or if they strengthen their own balance sheets. RealRate’s regression analysis (comparing the model’s strength scores to actual stock prices) indicates a positive correlation, implying that the market does reward financially strong brokers with higher valuations. If that holds true, Amplify and the gold trusts may see continued investor interest (indeed, ETF flows into gold funds have been robust). Conversely, if market conditions change, we might witness another reshuffling of ranks.
For now, 2025’s story is one of specialists triumphing over generalists. The broad lesson for the industry is clear: Capital matters. Firms that kept leverage low and capital high – even at the cost of lower day-to-day revenues – proved their resilience and then some. Amplify’s daring strategy and the gold funds’ disciplined structure both paid off handsomely, albeit via different routes. This year, fortune favored the bold (and the shiny).
Conclusion
In conclusion, the RealRate 2025 ratings for U.S. brokers highlight how unusual market conditions can produce breakout winners. Amplify Commodity Trust’s top ranking underscores the impact of a focused bet that succeeded beyond expectations. The SPDR and World Gold Trusts demonstrate the enduring value of a fortress balance sheet – when you carry almost no debt and your core asset’s value climbs, your financial strength can become practically unbeatable. While these three organizations might not resemble traditional “brokers” in their operations, they have set a new benchmark for financial robustness in the industry.
For the broader public, this ranking offers a fascinating insight: sometimes the safest vaults (filled with gold) and the nimblest risk-takers (surfing freight trends) outperform the household-name financial institutions. It reminds us that behind the scenes, financial strength isn’t just about size or fame, but about smart balance sheet management and seizing opportunities. The 2025 broker industry winners combined prudence with savvy bets – and thus sailed through volatility into a position of commanding strength. As we look to next year, all eyes will be on whether these commodity champions can hold their crown, or if more familiar faces will reclaim the spotlight in the ever-evolving financial arena.