
Small Funds, Big Health – A 2025 Overview
The U.S. finance services industry encompassed about $154 billion in total revenues in 2025, supported by a vast $1.45 trillion asset base . This sector includes firms ranging from global investment giants to niche financial vehicles. RealRate’s latest Economic Capital Ratio (ECR) rankings – an AI-driven measure of financial health essentially comparing a company’s economic value to its total assets – reveal a striking story: smaller specialized funds are outperforming many well-known titans in financial strength.
In fact, the industry’s average ECR hovers around 90%, but scores range from as low as ~3% for struggling outliers up to nearly 150% for the strongest player, indicating a wide spread of financial vitality. The standard deviation of ECR values is roughly 27 percentage points, reflecting significant variability across the 49 rated companies. Against this backdrop, a handful of firms have raced to the top with exceptional ECRs, signaling robust balance sheets and smart financial management in a turbulent market.
Who Tops the Rankings? The 2025 Top 3 Players
The RealRate 2025 ranking of U.S. Finance Services companies (based on 2024 results) crowns three firms as the Top 3 in financial strength, all posting ECRs well above 100%. These leaders – two boutique investment funds and a digital finance newcomer – outshine larger peers on the key metric of economic capital. Table 1 below highlights these top performers and their Economic Capital Ratios:
Chart 1: Top 3 Finance Services Companies by ECR (2025)
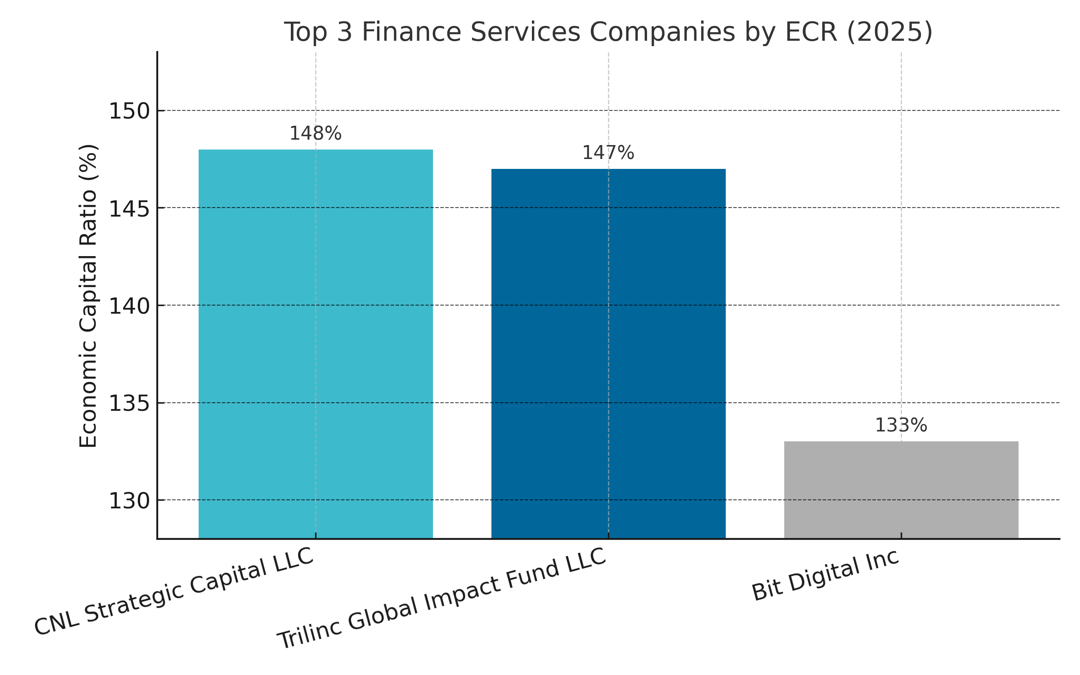
ECR represents economic value as a percentage of total assets.
These three firms boast extraordinarily high ECRs – meaning, relative to their asset size, they have generated substantial economic value or net worth. CNL Strategic Capital LLC, a specialty investment vehicle, retains the #1 rank for the second year running with an ECR of about 148% – indicating its economic value is roughly one and a half times its balance sheet assets. Trilinc Global Impact Fund LLC takes #2 at 147% ECR, nearly as strong. Bit Digital Inc, a newcomer to the rankings, debuts at #3 with a 133% ECR , making it the highest-ranked new entrant. All three far exceed the industry’s ~90% average ECR, signaling exceptional financial robustness.
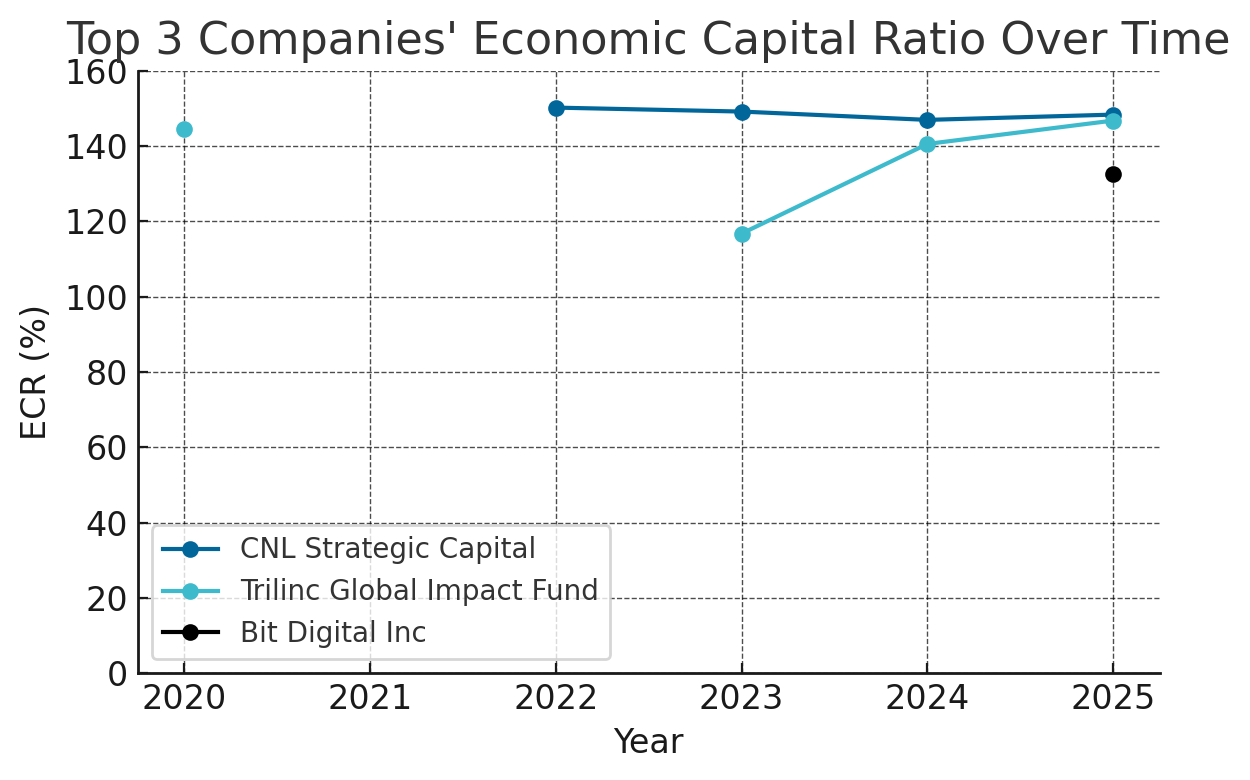
Figure 1: Economic Capital Ratio trends for the Top 3 companies over recent years. Each has markedly improved to surpass 130% ECR in 2025, well above the ~90% industry average. Gaps in lines indicate years where a company was not ranked in the top cohort.
How the Top 3 Got There
Despite their different profiles, the top three share a common formula for success: extraordinarily strong balance sheets with minimal debt, and healthy profits independent of traditional revenue streams.
- CNL Strategic Capital LLC – Rank 1, ECR 148%. CNL Strategic is a boutique investment fund that has parlayed a conservative strategy into outstanding financial strength. It holds about $1.29 billion in assets against only $56 million in liabilities , meaning nearly all of its assets are funded by equity. In fact, CNL’s stockholders’ equity is $1.23 billion – a whopping 95% of its assets – reflecting an extremely solid capital base. This ample equity cushion translated into robust net earnings of $110 million last year, despite the company reporting essentially no traditional “revenue” from sales. (Its income largely comes from investments and other gains.) RealRate’s analysis shows CNL’s greatest strength is indeed its equity level, which boosts its ECR by about +50 percentage points above the peer norm. The firm’s biggest weakness? A lack of operating revenue, which slightly detracts from its ECR (about –19 points relative to the industry). In simple terms, CNL’s low debt, high equity model has put it in pole position: its ECR is 59 points above the market average, making it the healthiest company of 2025. “We focus on permanent capital and minimal leverage,” CNL’s strategy implies – and it clearly pays off in financial stability.
- Trilinc Global Impact Fund LLC – Rank 2, ECR 147%. Trilinc Global Impact Fund, which finances impact investments, has made a dramatic comeback in financial fitness. Back in 2019, Trilinc was among the leaders, but subsequently slipped down the ranks for a couple of years. By 2022 (marketing year 2023) it was ranked just 12th. Now, after a surge in its fundamentals, Trilinc has rocketed to #3 in 2024 and up to #2 in 2025. Its ECR jumped from ~117% to 140% to 146.8% over the past three cycles, reflecting renewed strength. What changed? Largely, an improvement in equity and earnings. Trilinc’s latest balance sheet shows $285.6 million in assets vs. only $4.5 million in liabilities – essentially negligible debt – and about $281 million in equity capital. This nearly debt-free position allowed Trilinc to earn a solid $12.5 million net profit last year despite having no conventional revenue streams (it too relies on investment income). According to RealRate, Trilinc’s equity strength contributes an industry-best +55 ECR points to its score, while its lack of revenues costs it about –18 points . Overall, the fund’s Economic Capital Ratio of 147% is 57 points above average, signaling that its investors’ capital is very well-protected. Trilinc’s leap in rank — from #12 to #3 to #2 in just two years — underscores how quickly financial health can improve when a firm sheds risks or raises capital. It now stands as a model of stability in the impact investment arena, with nearly all of its assets backed by equity.
- Bit Digital Inc – Rank 3, ECR 133%. The biggest surprise in the top tier is Bit Digital, a relative newcomer from the cryptocurrency sector that has stormed into the rankings. Bit Digital is a Nasdaq-listed digital asset finance company, and 2025 marks its first appearance in the RealRate ratings – entering straight at Rank 3. With an ECR of 133%, Bit Digital is 43 points above the industry average, indicating very strong financial health. Unlike CNL and Trilinc, Bit Digital does generate substantial revenues – about $108 million in 2024 – but its expenses are also high (it’s an operating company, with $84 million in expenses) and it earned a net income of $28.3 million. The key to Bit Digital’s high ECR lies in its balance sheet structure: the firm holds $538 million in assets, financed by $463 million in equity and only $75 million in liabilities. In other words, equity covers about 86% of Bit Digital’s assets – an enviably solid ratio in any industry. RealRate’s breakdown highlights equity as Bit Digital’s top strength (+38 points) and identifies a relative weakness in a specific revenue category – “revenue from contracts with customers” – which cost it –11 points on the ECR scale. This likely reflects the nature of Bit Digital’s income (much of it may come from other sources like crypto mining rewards or investment gains rather than customer contracts). Even so, Bit Digital’s overall ECR of 133% demonstrates that it has ample capital for its asset base, making it the financially healthiest digital finance firm in the cohort. For a newcomer to debut so high suggests that the crypto winter’s survivors have become remarkably conservative and well-capitalized.
The Numbers Behind Stability: Balance Sheets Tell the Tale
Why are these three at the top? A quick look at their balance sheets tells a clear story – they simply don’t carry the debt burdens that most other companies do. Figure 2 illustrates the asset composition of the Top 3 companies, showing how much of each company’s assets are funded by stockholders’ equity (blue) versus liabilities (grey). The difference is striking:

Figure 2: Assets breakdown for the Top 3 companies (amounts in million USD). Blue portion represents stockholders’ equity, grey represents liabilities, summing to total assets (value labeled atop each bar). The Top 3 maintain extremely low debt levels – for CNL and Trilinc, the grey liability bar is almost invisible – indicating that their assets are almost entirely funded by equity.
In CNL Strategic’s case, for example, out of roughly $1.288 billion in assets, a whopping $1.231 billion is equity and a mere $56 million is liabilities. Trilinc shows a similar pattern: ~$281 million equity vs. $4.5 million debt on $286 million assets. Bit Digital has a bit more leverage but still conservative, with ~$463 million equity and $75 million liabilities against $538 million assets. These figures are practically off the charts compared to typical financial firms. By relying overwhelmingly on shareholder capital rather than borrowed funds, these companies enjoy higher resilience and flexibility. High equity means fewer fixed obligations and usually the ability to absorb losses – a direct contributor to a high ECR. It’s no coincidence that stockholders’ equity was identified as the single biggest positive “effect” on ECR for all three top companies.
In contrast, many lower-ranked firms carry far higher debt relative to their assets, dragging down their ECR. RealRate’s model penalizes excess leverage and rewards solid capital buffers. The top performers exemplify the latter.
Big Names vs. Niche Players: A Changing of the Guard
One striking aspect of the 2025 rankings is that household-name financial giants are nowhere to be found at the very top. Instead, specialized and newer players took the crown. Industry stalwarts and globally recognized asset managers are mostly clustered in the middle of the pack. For instance, Cohen & Steers, Inc., a well-known investment manager, came in at Rank 4 with a 132% ECR– respectable, but it ceded its former top spot from a decade ago to the new leaders. Over the long term, Cohen & Steers had been #1 for several years in the early 2010s, but by 2024 it had slipped to 8th and now improved to 4th.
More dramatically, some global investment behemoths score surprisingly low on this financial fitness scale. Apollo Global Management, Inc., for example, is ranked only 39th out of 49 with an ECR around 69%. Similarly, KKR & Co. Inc. sits at Rank 34 with about a 74% ECR – far below the median. These firms are massive by assets, but their high leverage and goodwill (or other intangible factors) mean their economic capital is a much smaller fraction of their assets, yielding mediocre ECRs. In short, bigger isn’t always better when it comes to financial health. The data suggests that smaller firms often maintain proportionally stronger balance sheets, whereas some large firms operate with thinner equity cushions.
At the same time, the 2025 results highlight some notable movers and shakers among the ranks:
- Coinbase Global, Inc. (the cryptocurrency exchange) made one of the biggest jumps, climbing from Rank 46 last year to Rank 14 this year. Its ECR improved to 103% after a tough 2022, indicating a successful strengthening of its finances. RealRate cites Coinbase’s excellent cash reserves as a key factor in its rise.
- On the flip side, Wright Investors’ Service Holdings, Inc. plunged from Rank 18 to Rank 31, a fall of 13 places, due largely to a deterioration in comprehensive income (i.e. recent losses) hurting its economic capital.
- In total, 7 new companies entered the ranking this year (including Bit Digital and several fintechoriented firms), reflecting how dynamic the sector is. New entrants can quickly upset the hierarchy if they bring strong balance sheets. Bit Digital’s top-3 debut is the prime example of this trend. Meanwhile, some weaker firms dropped out of the top 50 altogether, unable to meet RealRate’s inclusion criteria or overtaken by rising competitors.
Overall, the RealRate index data shows a mild upward trend in the industry’s financial health: the median ECR ticked up to ~84% this year from ~81.5% last year, and more companies are above 100% ECR than before. The distribution remains wide (see Figure 1’s range), but the top performers are pulling the pack upward. Still, there are several firms with ECRs in the double digits or even single digits, indicating potential vulnerabilities. A worst-case example is SHF Holdings (a small financial services firm), sitting at the bottom with an ECR of only ~2.9%, implying it has almost no economic capital relative to its assets. Such cases are rare but underscore the importance of sufficient equity – a sudden loss could wipe them out.
Secret Ingredients: What’s Driving the Winners?
For the top 3 companies, RealRate’s AI analysis pinpoints specific financial metrics – or “effects” – that most strongly influence their ECRs. Table 2 summarizes the biggest positive and negative factors impacting each Top 3 company’s ECR, as identified in the model’s output:
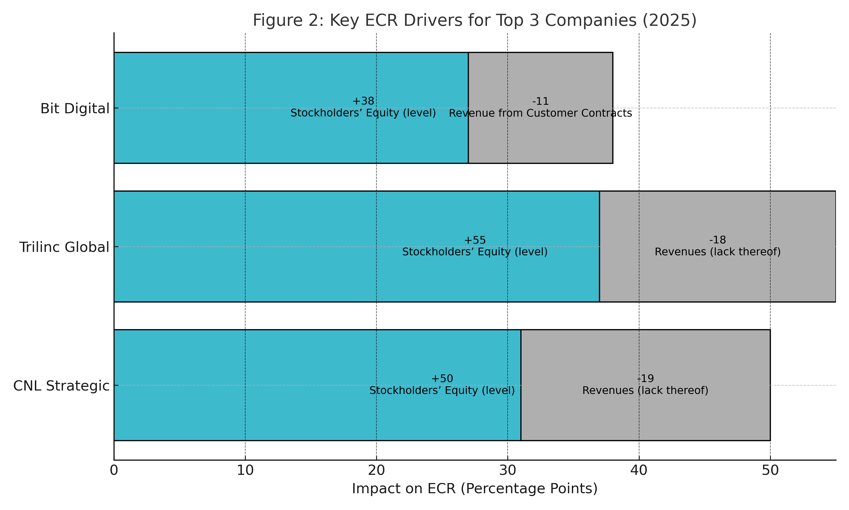
Interpretation: “Stockholders’ Equity” far above the industry norm boosts each company’s ECR by the number of percentage points shown. Conversely, low or zero revenue in certain categories reduces ECR by the points shown. These are the single largest positive/negative contributors for each firm, relative to industry-average levels.
Unsurprisingly, equity is king – each top company’s greatest strength is its high equity base, which dramatically elevates its economic capital ratio compared to peers. In effect, these firms have more skin in the game from shareholders and correspondingly less debt, which the model rewards. On the downside, having lower traditional revenues tends to hurt the ECR a bit because, in a broad industry context, firms that generate more revenue (for a given asset base) are seen as utilizing their assets more effectively. Both CNL and Trilinc essentially operate as investment vehicles with no conventional sales revenue – all their income is investment or finance-related – and this trait shows up as a negative factor (though not nearly enough to knock them off the top given their other strengths). Bit Digital does have revenue, but its weakest area was specifically revenue from customer contracts (it likely earns income in other ways, such as crypto mining rewards, which are categorized differently). In short, the winners are those with rock-solid capital structures, even if their business model is unconventional.
Another notable point is that profitability matters – but only in context. For example, all of the top 3 posted positive net income, which contributes positively to ECR. However, the RealRate model’s “effects” suggest that how that profit is generated can influence the score. Bit Digital’s relatively strong revenue helped it, but high operating expenses offset some of that benefit. Meanwhile, CNL and Trilinc show that one can achieve high financial health with modest earnings but very low risk – their net incomes are not extraordinary relative to assets, but because they carry so little debt, even average earnings suffice to keep ECR high. The market average ECR of ~90% corresponds to a typical mix of about 10% liabilities-to-assets across the industry (since 90% ECR implies roughly 90% equity funding on average). The top 3 blew past that by taking on even less liability and maintaining solid profits.
Outlook: Stability in an Uncertain World
The 2025 RealRate ratings for U.S. finance services companies highlight a compelling narrative: in an industry often associated with leverage and risk, the most financially resilient players are those bucking the high-debt trend. The likes of CNL Strategic Capital and Trilinc Global Impact Fund – niche, conservatively financed funds – have demonstrated that prioritizing equity and stability can yield top-tier financial strength ratings, even outperforming far larger competitors. Their success, along with Bit Digital’s strong debut, suggests a shift in what “good” looks like: the market is rewarding sound fundamentals and prudent balance sheet management over sheer size or aggressive growth.
For investors and the general public, these rankings are a useful lens on hidden health indicators. A company’s ECR encapsulates many aspects of financial wellness (capital adequacy, profitability, risk exposure) into one percentage. Seeing so many firms above 100% ECR is encouraging, as it means they have more economic value than assets – a sign of strong value creation and safety buffers. Of course, the flip side is that a few firms lag dangerously behind, a reminder that not all boats have risen with the economic tide.
Going forward, it will be interesting to watch whether the big-name financial companies take a page from the top-rated firms’ playbook by deleveraging and strengthening equity. Will we see the heavyweights climb back up in the rankings by shoring up their balance sheets? Or will agile, smaller companies continue to set the pace? For now, 2025 belongs to the nimble and the cautious – proof that in finance, slow and steady can indeed win the race when it comes to long-term health. The champions of 2025 have shown that boring balance sheets can be a very exciting thing.
U.S. Finance Services Ranking Video: