How Strong Balance Sheets Put Clearwater Analytics and Peers on Top
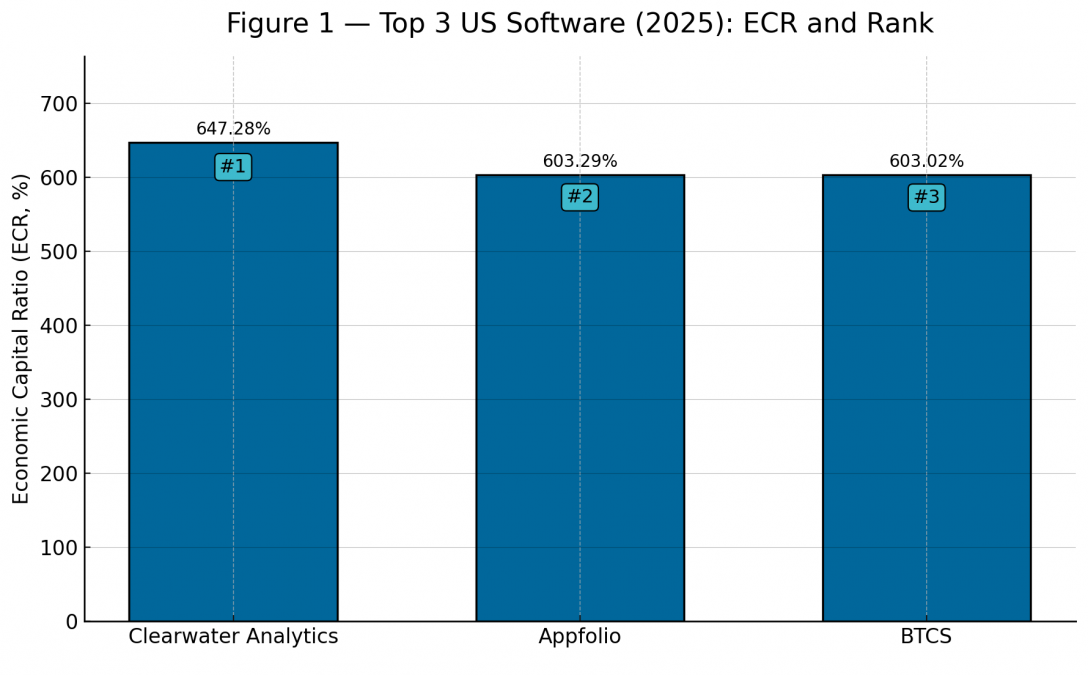
The U.S. software industry has just received a financial fitness report card – and a few unexpected players are leading the class. An artificial intelligence-driven rating model ranked 140 software companies by their Economic Capital Ratio (ECR), a measure of financial strength that levels the playing field between big and small firms. In 2025, Boise-based Clearwater Analytics Holdings emerged at #1, outpacing larger and more famous competitors. Close behind were Appfolio Inc at #2 and tiny BTCS Inc at #3. These top performers share a common trait: exceptionally strong balance sheets with high equity and very little debt. In contrast, companies with heavier debt loads or persistent losses found themselves far down the rankings. The result is a fascinating shake-up – one where solid fundamentals sometimes trump sheer size or hype.
Financially, the software sector is booming. In 2025, the 140 rated U.S. software firms generated roughly $235 billion in total revenues and held about $486 billion in combined assets. They collectively maintained around $257 billion in stockholders’ equity, underscoring the sector’s solid capitalization. Yet within those aggregate numbers lies tremendous variability in financial health – from a handful of struggling outliers to a top tier boasting sky-high ECRs that reflect stellar fiscal fitness.
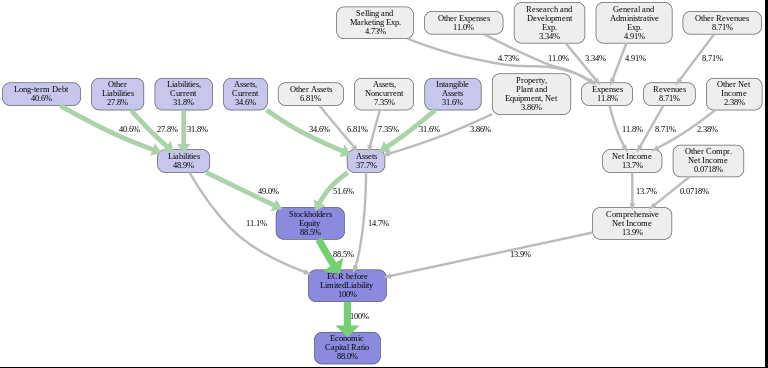
Fig. 2: Simplified model of key financial drivers (industry-wide). The AI model links various balance sheet and income statement factors to a company’s Economic Capital Ratio. Green arrows indicate positive effects on ECR, red arrows negative. Stockholders’ Equity (bottom left) is by far the largest contributor, boosting ECR by roughly 88.5 percentage points on average, whereas high liabilities and expenses reduce ECR. Profits feed into equity, while debt and costs detract from the economic capital measure.
The feature importance diagram above confirms that stockholders’ equity is king in this rating model. In fact, equity (assets minus liabilities) contributes the bulk of a company’s ECR, dwarfing other factors. This means that companies which have built up a strong capital base – whether through retained earnings or investor funding – start with a major advantage. Liabilities, by contrast, cut into the ratio: the more debt or other obligations a company carries, the more it erodes its economic capital relative to assets. Income and expenses also matter: higher revenues and profits improve ECR, while heavy operating expenses (like R&D or marketing) and any losses will hurt it. In short, the AI’s verdict aligns with age-old financial wisdom: stay well-capitalized, keep debt in check, and mind your costs.
The New Leaders: Clearwater, Appfolio, and BTCS
This year’s rankings crowned three companies that exemplify financial fitness in different ways. Clearwater Analytics, a provider of SaaS investment accounting solutions, shot to #1 thanks to an almost unimpeachable balance sheet. The company’s ECR is an astonishing 647%, meaning its economic value is over six times its asset base. How is that possible? A look at Clearwater’s books tells the story: it has over $1.03 billion in equity against only about $139 million in total liabilities. Essentially, Clearwater carries very little debt and has accumulated a large cushion of net assets. It’s also profitable – last year it earned about $428 million net on $452 million in revenue, an enviable margin. This combination of low liabilities and high equity turbocharged its ECR. Clearwater’s strengths relative to peers include extremely low short-term debt (a major plus for its ECR) and controlled operating costs. Its weakness, interestingly, is that it does invest significantly in research and development, which slightly weighs down its rating – but only by about 9 percentage points, a drop in the bucket compared to the 292-point boost it gets from its equity might. The net result is a company that vaults from a respectable rank 24 last year straight to #1, after increasing its ECR by over 140 percentage points in a single year.
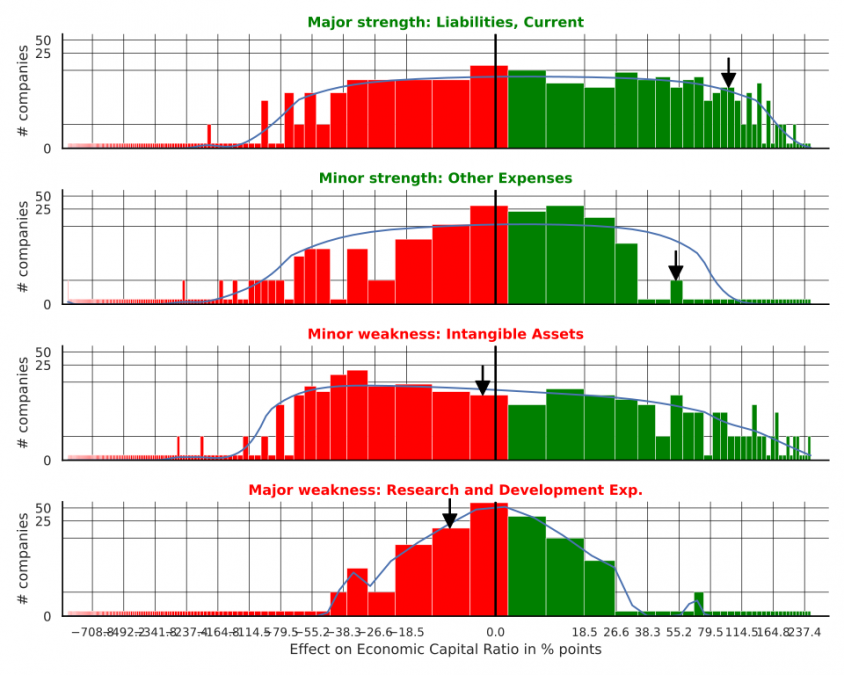
Fig. 3: Distribution of certain factor effects across the industry, highlighting Clearwater Analytics (black arrows). In each chart, red bars indicate weaker effect (negative impact on ECR) and green bars indicate stronger effect (positive impact on ECR). Clearwater’s arrows show it significantly outperforms peers in areas like Current Liabilities (top panel, far right arrow, indicating extremely low debt – a major strength) and Other Expenses (second panel, arrow toward right, a minor strength). It lags slightly in Intangible Assets (third panel, arrow toward left, a minor weakness) and notably in R&D Expense (bottom panel, left arrow, its major weakness due to high R&D spending). Overall, Clearwater’s advantages vastly outweigh its weaknesses.
Sitting at #2, Appfolio Inc – a California-based SaaS company serving property managers – is another case study in the power of a strong capital base. Appfolio’s 603% ECR reflects that about 83% of its assets are funded by equity. The company’s finances are rock-solid: it has around $519 million in equity versus $107 million in liabilities, and it earned roughly $204 million in profit on $794 million revenue last year. The RealRate model flagged low liabilities as Appfolio’s greatest strength (boosting its ECR by an estimated 273 percentage points). Indeed, Appfolio carries modest debt, preferring to grow with funds from operations and equity. Its biggest weakness was, once again, R&D expenditure, which trimmed about 16 points off its ECR – a small penalty given its healthy margins. Appfolio climbed from rank 22 to 2 in one year, demonstrating how rapid financial improvement (or a model recalibration) can propel a company upward. The message: prudent financial management and profitability have put Appfolio in the top-tier club, even above many larger software firms.
And then there’s the surprise #3 finisher, BTCS Inc. This tiny blockchain and cryptocurrency-focused company, based in Silver Spring, MD, is hardly a household name – yet it boasts an ECR of 603%, virtually tied with Appfolio. How did a microcap with only about $4 million in annual revenue land among the elite? BTCS’s secret is its capitalization. The company has almost no debt on its books and is funded almost entirely by shareholder equity. In fact, BTCS has about $34 million in equity against just $4.2 million in liabilities. This means it has a huge safety net relative to its size – investors have poured in capital, and the company hasn’t leveraged itself with loans. The model sees that as a major plus (BTCS’s equity strength adds roughly +293 points to its ECR). However, BTCS is currently unprofitable and has scant revenue, which the model flags as a weakness. The category “Other Revenues” was the biggest drag on its score (–28 points), implying BTCS’s sales are very low compared to industry norms. In effect, BTCS is being buoyed by investor capital more than business income. This highlights an intriguing aspect of the RealRate methodology: it rewards companies for having a strong balance sheet even if their income statement is underwhelming. BTCS exemplifies this by riding its cash reserves and equity to a high rating (it was ranked #1 last year) despite operating losses. It’s a double-edged sword – such a company is financially stable for now, but without improving revenues, one wonders how sustainable that strength is. For the time being, though, BTCS’s conservative financial stance keeps it among the top three.
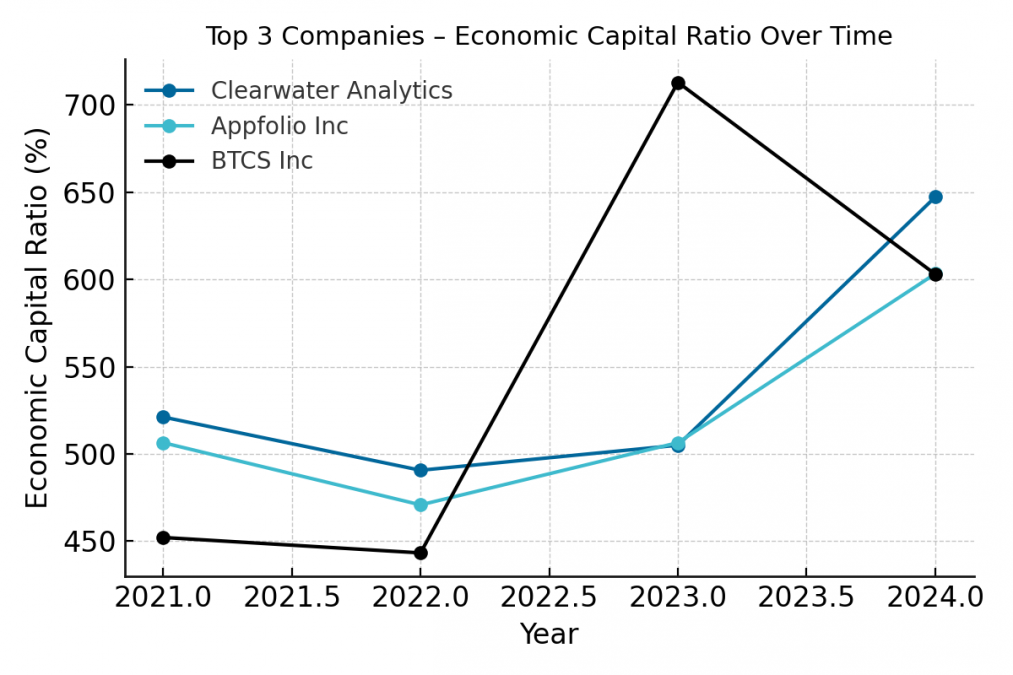
Fig. 4: Economic Capital Ratio trends for the top 3 companies over the past few years. Clearwater Analytics (blue line) and Appfolio (teal line) both saw steady ECR levels around 500% until 2023, then each jumped above 600% in 2024 as their equity grew sharply. BTCS Inc (black line) had an especially dramatic swing: its ECR soared from 443% to an eye-popping 713% in 2023 when it raised capital, then moderated to 603% in 2024 after using some cash. This volatility shows how capital changes can impact smaller firms’ ratios.
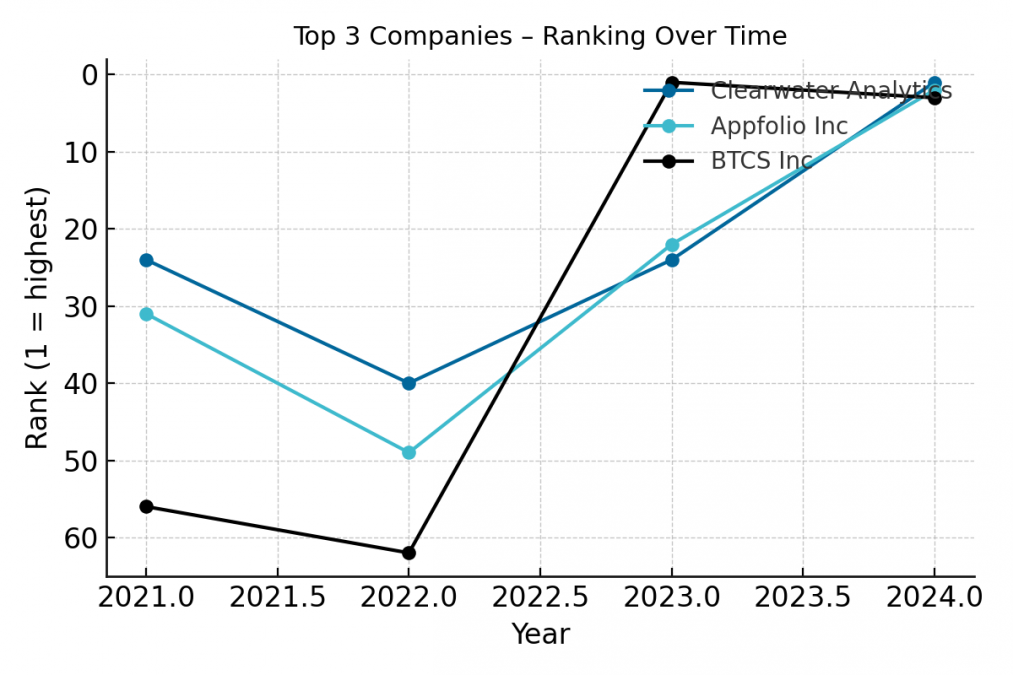
Fig. 5: Ranking positions of the top 3 companies over time. Clearwater (blue) and Appfolio (teal) improved their ranks significantly in 2024 (lower rank number is better). Clearwater leapt from #24 to #1 in one year, while Appfolio went from #22 to #2. BTCS (black) had jumped from #62 to #1 between 2022 and 2023, then settled at #3 in 2024. These big rank moves correspond to large changes in ECR, highlighting how dynamic the industry’s financial landscape can be.
Behind the Scenes: How the AI Spotlights Strengths and Weaknesses
RealRate’s AI doesn’t just spit out a single number; it also analyzes why a company’s ECR is high or low compared to the market. For each firm, the model identifies its key strengths and weaknesses – specific financial metrics where it outperforms or underperforms the industry average. This provides a sort of diagnostic report. For example, in Clearwater’s case, the AI determined that stockholders’ equity was its greatest strength, increasing its ECR by an astonishing 292 percentage points above the average. No surprise there – Clearwater’s equity ratio is far higher than most peers, giving it a huge edge. On the flip side, Clearwater’s heavy R&D spending was cited as its biggest weakness, shaving about 9.5 points off its ECR. In other words, if Clearwater spent the industry-average amount on R&D (relative to size), its ECR might have been even higher! Still, a 9-point hit is trivial in context of 647% – clearly, the company’s strengths overwhelm its weaknesses.
We can visualize how a top company’s strengths have evolved. In the graph below, green represents Clearwater’s equity effect and red represents its R&D effect over time. Notice how in 2024 the green line (equity boost) skyrocketed, reflecting a huge increase in equity that year, while the red line (R&D drag) remained relatively small. This illustrates a pattern common to the top performers: they are improving their positives faster than their negatives. Appfolio shows a similar pattern with its equity and liability management, and even BTCS – despite negligible revenue – maintained its equity cushion.
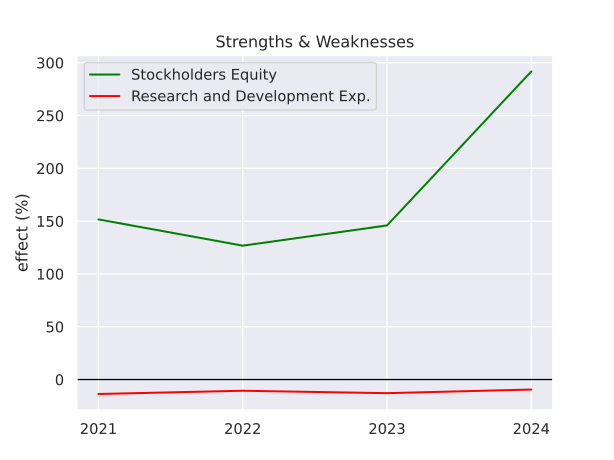
Fig. 6: Clearwater Analytics’ biggest strength vs. weakness over time. The green line shows the positive impact of Clearwater’s Stockholders’ Equity on its ECR each year (in percentage points above the market norm), and the red line shows the negative impact of its R&D expenses. From 2021 to 2023, equity gave Clearwater ~150–175% extra on its ECR, while R&D cost it a small single-digit percentage. In 2024, equity’s effect surged to nearly +300% as Clearwater’s capital base grew, dwarfing the modest ~–10% effect of R&D spending. This balance of very large strengths against small weaknesses propelled Clearwater to the top rank.
The AI model similarly diagnosed Appfolio’s strengths as primarily its low liabilities (indicating conservative financing and adequate equity) and its weaknesses as high R&D and possibly other operating expenses. Appfolio’s report noted that liabilities increased its ECR by 273 points versus the average, while R&D expenses reduced it by 16 points. This trade-off – invest in innovation, but pay a small price in the ratings – seems to be a conscious choice for many software firms. Even the best companies spend significantly on R&D (it’s the lifeblood of software development), but as long as they keep those costs in proportion to their revenue and maintain strong equity, the impact on the rating is manageable.
For BTCS, the story was a bit different. Its strength was purely its stockpile of equity relative to assets (nearly +300 points ECR effect), while its weakness was an extremely low revenue stream (“Other Revenues” effect was –28 points). In plain terms, BTCS has cash and crypto assets on hand (raised from investors) which count toward its economic capital, but its operating business is minimal. The AI picked up on that imbalance. This highlights how RealRate’s approach can sometimes favor early-stage or transition companies that have a strong capital position even if their current earnings are weak. It’s a double-edged sword: those companies might not stay highly rated for long if they start burning through that capital without generating income. However, it does give credit where due for financial stability in the present.
Big Movers, Newcomers, and Industry Trends
Beyond the top three, the 2025 rankings offered plenty of intrigue. For one, it wasn’t just the usual tech titans dominating the list – in fact, some well-known names were absent from the very top. Instead, medium-sized and niche players with stellar balance sheets populated the top 10. (Many Silicon Valley darlings, which sometimes prioritize growth over profitability, didn’t score as well on this strictly financial test.) The RealRate model effectively asks, “Who could weather a storm best, purely based on financial cushion and efficiency?” – and the answers included companies that might not be headline grabbers but are extremely well-run behind the scenes.
We also saw some remarkable rank jumps and drops this year. The most dramatic climb came from CareCloud Inc, a smaller healthcare software firm that leapt 66 places, from rank 88 all the way to 22. What caused such a surge? The AI attributed CareCloud’s rise to “excellent Liabilities,” meaning the company significantly improved its debt position or increased equity (or both). Essentially, CareCloud cleaned up its balance sheet, and the model rewarded it handsomely. On the flip side, Iveda Solutions Inc plummeted 51 spots (from 28 down to 79) largely due to “bad Assets,” according to the model. In context, that likely means Iveda’s asset quality or equity shrank relative to liabilities, weakening its economic capital standing. It could be that Iveda took on debt or suffered losses that eroded its equity – whatever the case, the AI took note and pushed the company far down the ranks.
Meanwhile, a notable newcomer to the ratings made a splash: Shopify Inc entered the ranking for the first time (after its initial public filings became available for analysis) and debuted at rank 6. That makes Shopify the highest-ranked newcomer of 2025. Even though Shopify is known for aggressive growth, it appears to have maintained a solid capital structure (perhaps aided by equity raises in past years), securing a top-ten position out of the gate. This underlines that high growth and high financial strength aren’t mutually exclusive – a company can invest in expansion and still keep a strong balance sheet, if managed wisely.
Industry-wide, the average ECR was around 352%. So even the “typical” software company has economic capital equal to 3.5× its assets – a sign that, overall, the sector is well-capitalized. Software companies generally carry less debt and more cash relative to assets than, say, heavy industrial firms. This makes sense: many software businesses are funded through equity (venture capital or stock offerings) and produce healthy margins, so they often accumulate substantial equity. However, the range of ECRs was extremely wide, from Clearwater’s 647% at the top all the way down to a barely 0.14% at the bottom. A few companies even logged negative ECRs, meaning their liabilities actually exceed their assets (a precarious situation indicating insolvency risk). Such firms are outliers – essentially, they owe more than they own, a recipe for trouble if not corrected. The existence of some negative or near-zero ECR companies in the dataset shows that while the software industry is booming, not every player is sharing in the financial success. Some are clearly struggling to stay afloat and likely reliant on external financing to survive.
Another intriguing trend is how back-testing validates the model. When RealRate’s analysts compare the AI’s ratings to real-world outcomes (for example, how companies performed subsequently or other measures of financial distress), they find a strong correlation. The model’s scatter plots of expected vs. actual capital ratios show most companies clustering around the ideal line, indicating that the ECR metric is a reliable indicator of financial robustness. In simpler terms, companies that the AI rates highly tend to indeed be more financially secure and resilient, while those it rates poorly often encounter difficulties (or at least have a profile that could lead to trouble). This gives confidence that the rating isn’t just an academic exercise – it has practical predictive value. Stakeholders like investors, creditors, or even the companies themselves can glean insights from it: if your ECR is low, it’s a prompt to shore up your finances.
Outlook: Financial Strength as a Competitive Advantage
The 2025 RealRate software industry rankings remind us that in the tech world – often obsessed with growth at any cost – financial fundamentals still matter profoundly. Companies that balance innovation with sound fiscal management are being recognized (and in turn enjoy greater stability and credibility). Clearwater Analytics’ CEO, for example, has publicized the importance of a “fortress balance sheet” as a strategic asset. This year, that approach clearly paid off, with Clearwater now wearing the crown of financially strongest U.S. software company. Appfolio’s disciplined growth and BTCS’s cautious, cash-heavy strategy similarly demonstrate that there are many paths to the top of the ratings, not just having blockbuster sales.
For investors and industry watchers, these ratings are a useful lens. They highlight firms that are built for the long haul, not just the next quarter. A high ECR can indicate ability to weather economic downturns, invest in future opportunities without overstretching, and even potentially return value to shareholders. It’s no guarantee of stock performance, of course, but it does speak to a company’s resilience. Conversely, firms with very low ECRs may be one shock away from crisis, even if their revenue growth is currently impressive. As rising interest rates and economic uncertainties loom, such highly leveraged or thinly capitalized companies could find themselves in trouble. We may well see some names on the lower end of the ranking either make drastic improvements or risk disappearing in the coming years.
Finally, it’s worth noting that financial strength and innovation are not mutually exclusive. The top companies still invest in R&D and growth; they just do so responsibly. The RealRate model essentially champions sustainable growth – rewarding those who can innovate while also maintaining prudent financial buffers. In the U.S. software sector, where competition for market share is fierce and the temptation to overspend is ever-present, this is a refreshing perspective. It suggests a shift (at least among the leaders) toward more balanced business models.
As we look ahead, one might expect more companies to heed the lessons of this ranking. After all, being financially fit doesn’t just earn a nice rating badge – it means a company is equipped to seize opportunities and survive challenges that weaker rivals cannot. In an industry defined by rapid change, that kind of robustness is the ultimate competitive advantage. The RealRate 2025 ratings have thrown down the gauntlet: manage your capital wisely, or be prepared to be outranked by those who do.