After a turbulent few years, German life insurance companies are jostling for the top spots in 2025. We explore who came out on top, how the industry as a whole is faring, and what drives a life insurer’s success – from robust capital buffers to future profits, and even how liabilities can drag them down.
A Resilient Market with Robust Revenues: The German life insurance industry remains a giant, with annual premium revenues around €92 billion. Despite a slight dip in recent years due to economic headwinds, insurers expect stability and a return to modest growth. Rising interest rates are improving earnings and making life policies more attractive again. Overall, the industry’s scale – nearly a hundred billion euros in premiums – underscores its importance in Germans’ financial lives. (This context sets the stage for understanding the competitive landscape among insurers.)
Ranking Shake-Up in 2025
The latest RealRate ratings for 2025 reveal a surprising shake-up at the top of the German life insurance market. After recalculating all companies’ Economic Capital Ratio (ECR) – an all-important measure of financial strength – the ranking has a new leader. Ideal Leben has claimed the #1 position with an ECR of about 12%, narrowly edging out BY die Bayerische Vorsorge (around 11%) and Heidelberger Leben (about 10%). All three have ECRs roughly double the industry’s average (~5.8%), reflecting exceptional capital strength.
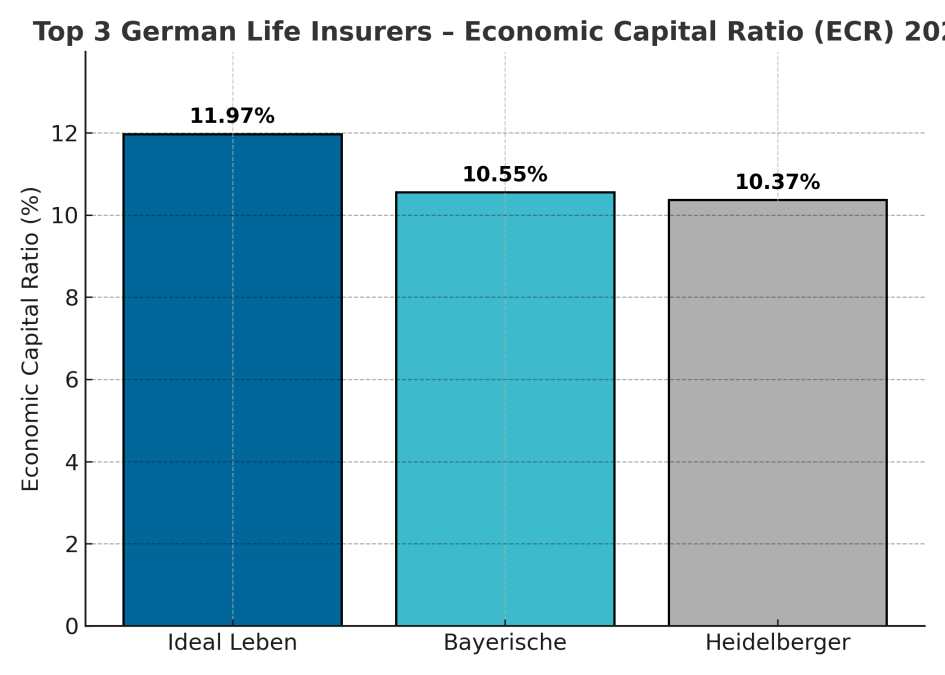
Figure 1: The top three German life insurers in 2025 by Economic Capital Ratio (ECR). Higher ECR means a larger share of economic capital relative to assets, indicating stronger financial resilience.
These results mark a changing of the guard. For years, industry veterans like HUK-Coburg Leben or Deutsche Ärzteversicherung (DÄV) often hovered near the top. But in the 2025 rankings, HUK-Coburg has slipped to 8th place, and DÄV, once consistently in the top five, has fallen out of the top ten in recent years. In their place, smaller or once lesser-known players have risen dramatically. Bayerische Vorsorge leapt from 24th place a few years ago to #2 today – an impressive climb fueled by strategic focus on capital growth. Heidelberger Leben made an even more startling jump: it was mid-pack (15th) in 2022, shot up to #1 in 2023, and now ranks #3. Such volatility is rare and speaks to one-off changes (we’ll explore those later) as well as the dynamic nature of the market.
Perhaps the most eye-popping story is Helvetia Leben. In 2022, this insurer rocketed to the top rank with an unusually high ECR (over 14%), only to plummet to near-bottom (rank 57) in 2023 with an ECR barely above 2%, and recover slightly to rank 49 in 2024. Industry analysts believe this wild ride was due to extraordinary items – possibly a one-time capital injection or restructuring gain in 2022 that temporarily boosted Helvetia’s capital ratio, followed by normalization. It’s a vivid reminder that an insurer’s fortunes (and ranking) can swing dramatically with major balance sheet events.
Overall, the spread of ECRs in the market is wide. The strongest firm (Ideal Leben) is sitting on ~12% ECR, while at the bottom, some firms barely have any economic capital relative to their obligations – for instance, Concordia oeco Leben has an ECR close to 0.2%, effectively running on fumes. In fact, about 14 insurers (a quarter of those rated) have ECRs under 4%, highlighting a long “tail” of weaker players. Most companies cluster around the mid-single digits. The industry average ECR of ~5.8% shows that many insurers have only modest buffers. Notably, the average ECR ticked down slightly from the previous year (by about 0.5 percentage points on average), indicating that 2024’s market conditions (for marketing year 2025) were a bit tougher – likely due to interest rate changes affecting asset values and reserve requirements.
The standard deviation of ECRs is roughly 2.4 percentage points, underlining substantial disparity: some insurers are extremely well-capitalized, while others are lagging. This competitive gap explains why only a handful of firms consistently vie for the top ranks.
The Top Three Insurers and Their Journey
Who exactly are these top three, and what propelled them to the summit?
- Ideal Leben – A mid-sized life insurer that has steadily climbed the rankings. Ideal’s ECR increased from around 7% in 2019 to nearly 12% now. It jumped into the top 5 by 2021 and now finally to #1. Ideal’s secret sauce is its consistent strengthening of capital and reserves, outpacing peers over the last few years. By 2025, Ideal Leben’s economic capital – the cushion available to absorb losses – is about 12% of its total assets, which is roughly double the market average. This means Ideal can easily cover its liabilities and then some. Over time, Ideal went from rank 22 in 2016 to the single digits by 2021 and is now rank 1. It’s a textbook case of gradual improvement (with a big surge in 2022 when its ECR spiked to 13.4%). Ideal’s balance sheet is solid: approximately €3.5 billion in total assets (at market value) against about €3.0 billion in liabilities. Its book equity (shareholders’ capital) is relatively small – only around €56 million in nominal terms – but it has hefty hidden reserves and future profit mechanisms that bolster its economic capital to about €526 million. In other words, Ideal’s true financial strength comes from more than just plain equity: unrealized gains, future surplus allocations, and other buffers add hundreds of millions to its capital base.
- BY die Bayerische Vorsorge – Often just called “die Bayerische,” this is a unit of the Bayerische insurance group focused on life policies. Bayerische Vorsorge was not even ranked in the top 20 prior to 2021. But it made a remarkable charge: from 26th in 2019 to 6th in 2021, and now holding #2 for two years running. Its ECR rose from under 7% to over 11%. What changed? Essentially, Bayerische aggressively boosted its economic capital. By 2025, it enjoys roughly €396 million in economic capital, giving an ECR of ~11%. The company’s assets total around €3.0 billion; it carries significant life insurance reserves (over €2.2 billion in technical reserves for policies) and has been shoring up its equity. Bayerische’s book equity is about €255 million – already larger than many rivals – but even that is augmented by additional reserves. The firm also benefited from strong profits in 2021–2022, which were retained to strengthen reserves (for example, it built up extra interest buffers). The result is a sustained high ECR. Bayerische’s rise reflects a deliberate strategy to capitalize on its life business strongly – an effort that clearly paid off in the RealRate model.
- Heidelberger Leben – Perhaps the most intriguing of the top three, Heidelberger Leben (now part of the run-off platform Abraß) was virtually absent from the rankings until recently. It first appeared at 15th place in 2022, then shot to #1 in 2023 with an ECR above 13.5%, and in 2025 stands at #3 with ~10.4%. What’s going on? Heidelberger Leben manages closed life insurance books – it took over many older policies from other insurers. In 2022, changes in regulations and interest rates massively reduced the burden of guaranteed rate policies, suddenly freeing up economic capital for run-off insurers. Heidelberger saw its ECR explode as its liabilities shrank (relative to assets) when interest rate buffers were released. In concrete terms, Heidelberger Leben has a huge balance sheet – about €15.8 billion in assets – largely because it holds €14.7 billion in separate unit-linked funds for policyholders. These unit-linked contracts actually boost its ECR, because the investment risk is borne by policyholders (reflected by a positive effect on capital). Excluding those, the remaining traditional business is smaller, but here Heidelberger had very large obligatory reserves that previously dragged it down. With interest rates rising, the company could release some of those reserves. However, Heidelberger still has a relatively tiny amount of actual equity (around €12 million book equity). Its economic capital is made up mostly of the difference between market and book values in its massive portfolio and expected future profits on policies. It also has significant “hidden liabilities” adjustments: for example, it carries a huge amount of latent reserves on the liability side (due to guaranteeing old high-interest policies) – this was a negative factor that slashed its ECR. In fact, Heidelberger’s greatest weakness is exactly that: very large traditional reserves which, even after some release, still weigh heavily. That’s why its ECR fell back from 13.6% to 10.4% as some conditions normalized. Even so, an ECR above 10% keeps it among the elite. Heidelberger Leben’s ride illustrates how changes in the economic environment (like interest rates) can dramatically alter an insurer’s capital situation. It basically went from an undercapitalized book to an adequately capitalized one overnight due to those macro factors – and RealRate’s model captured that swing in the rankings.
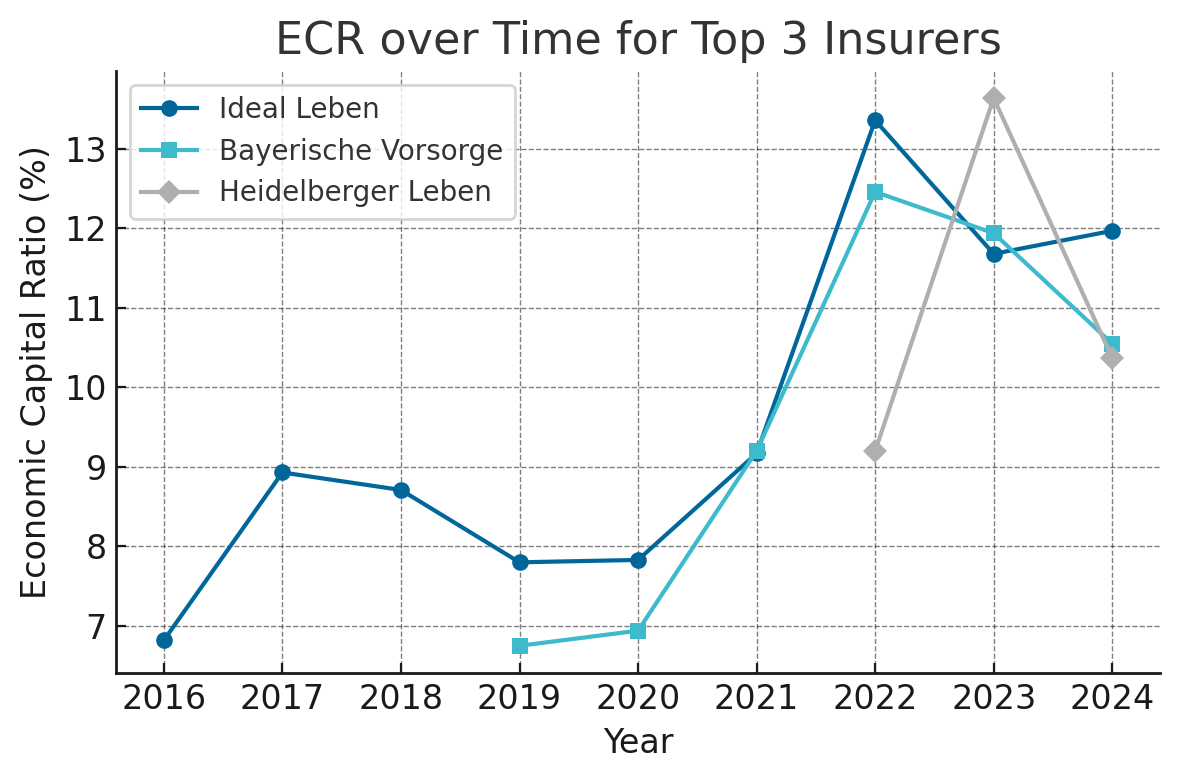
Figure 2: Economic Capital Ratio (%) over time for the current top 3 insurers. Ideal Leben (dark blue) has shown steady improvement with a big jump in 2022, Bayerische Vorsorge (light blue) surged around 2021–2022, and Heidelberger Leben (grey) had an exceptional spike in 2023 followed by a dip. This chart highlights how quickly fortunes can change in the life insurance industry.
Beyond the top three, other notable movers include BL die Bayerische (a sister company of BY Vorsorge) which was ranked #1 back in 2018 but has since plummeted to 34th as its capital advantage eroded. Meanwhile, Deutsche Ärzteversicherung (DÄV), long a top contender, fell from 2nd to 13th in 2022 (when a new reserve strain hit) but has partially rebounded to 7th in 2025. This volatility emphasizes that a company’s rank is not static – it responds to real financial developments. RealRate updates past years’ results when their model is refined, so historical rankings may shift retrospectively as well.
Why These Companies Excel: Strengths and Weaknesses
What specifically gives the top three their edge? RealRate’s analysis doesn’t just stop at the numbers – it diagnoses strengths and weaknesses by comparing each firm’s financial metrics to industry norms. The Economic Capital Ratio (ECR) is influenced by numerous factors on the balance sheet and income statement. In simple terms, higher assets and profits boost ECR, whereas higher liabilities and costs drag it down.
Each of the top three has a different profile:
Ideal Leben’s strengths: The single biggest contributor to Ideal’s high ECR is its future shareholder profits. Essentially, the company is expected to generate above-average profits from its existing policies – this expectation adds about +7.0 percentage points to its ECR compared to a company with average profit outlook. Ideal also benefits from strong hidden reserves on the asset side (unrealized gains in its investment portfolio) and a high proportion of discretionary reserves. These factors indicate prudent investment and provisioning in the past, now counted as economic capital. On the flip side, Ideal’s weakness (relative to peers) is its exposure to unit-linked life insurance (fondsgebundene Lebensversicherung). Typically, unit-linked policies transfer investment risk to the policyholder, which can actually help capital – but in Ideal’s case, having a somewhat lower volume of unit-linked business than the industry average means it doesn’t get as much of that benefit (i.e. its ECR is reduced by about –1.4 points due to this factor). Overall, Ideal presents a well-balanced picture with no major negatives – its strengths decisively outweigh the minor weaknesses. No wonder it rose to the top.
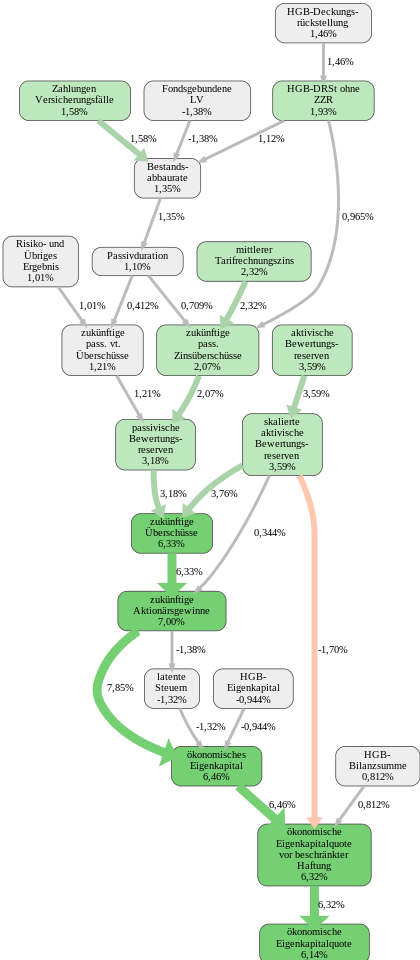
Fig. 3: Causal Graph for Ideal Lebensversicherung (simplified). Green denotes factors where Ideal outperforms the market, red where it underperforms. Notably, “future shareholder profits” (bottom right) is a major positive contributor (+6.7 pp to ECR), while “deferred taxes” (red box at left) is a minor drag (–1.1 pp).
In the graph, each node is a financial variable and each arrow shows its effect on the final ECR. For Ideal, you can see large green nodes in the profit section, indicating above-average future profits (a key strength). The small red node for latent taxes signals a weakness, but its impact is relatively minor. Cumulatively, Ideal’s strengths outweighed weaknesses – hence its superior ECR.
- Bayerische Vorsorge’s strengths: This company’s defining strength is the sheer size of its economic equity base. RealRate’s model identifies “ökonomisches Eigenkapital” (economic capital) as contributing about +5.0 points to Bayerische’s ECR above the norm. In practice, Bayerische has built up more available capital (relative to its assets) than most insurers, which is a straightforward advantage. It means the firm’s cushion – including all retained earnings and reserves – is significantly larger than average, giving it stability and boosting its rating. Bayerische also benefits from other plus factors, like a moderately positive impact from market-value asset reserves. However, it has a notable weakness: high “passivische Bewertungsreserven”, which are basically hidden reserves on the liability side – in other words, obligations that are higher than they appear on the surface. This feature, linked to things like long-term guarantees and additional policyholder bonus reserves, reduces Bayerische’s ECR by roughly –2.5 points relative to a company with fewer such obligations. Put simply, Bayerische carries a heavier burden of guaranteed commitments (or has less release of old reserves) than some peers, which knocks its capital ratio down a bit. Even so, the firm’s proactive strengthening of capital more than compensates for this drawback.
- Heidelberger Leben’s strengths and weaknesses: As discussed, Heidelberger is a story of pluses and minuses in extreme. Its greatest strength is its expected future shareholder profits, contributing a hefty +6.2 percentage points to ECR. This indicates that, despite running a closed book, the company is projected to extract significant profits from the existing policies (for instance, by efficient cost management of the run-off and by eventually releasing reserves to shareholders). Another big positive is Heidelberger’s large unit-linked portfolio; having €14+ billion in unit-linked funds means a lot of risk is carried by policyholders, not the insurer. This is reflected as a strong positive effect (over +5 points) on Heidelberger’s ECR – effectively, those contracts require less insurer capital. On the weakness side, Heidelberger Leben is massively held back by its huge traditional reserve liabilities. Specifically, its HGB deckungsrückstellung (the statutory mathematical reserve for guaranteed policies) is extraordinarily large relative to its assets, and RealRate calculates this feature alone costs the company a whopping –24.7 percentage points off its ECR. In other words, if Heidelberger had an average level of reserves, its ECR might be in the mid-30% range (!) – but of course, it does have these obligations, stemming from legacy policies with high guaranteed interest rates. This one factor nearly nullifies many positives. Additionally, the reserves excluding the extra interest buffer (ZZR) impose another ~–22 point penalty. These are enormous negatives that most other insurers don’t face to such a degree. The fact Heidelberger still achieves ~10% ECR shows that it counterbalances the liabilities with other strong points. However, as interest rates changed, it partially released those reserves (which is why its ECR shot up in 2023 and then came down when some reserves had to be strengthened again). Heidelberger’s profile underscores how liability-heavy balance sheets can severely constrain capital ratios – a key theme in life insurance.
The RealRate model compiles all these effects for each company in a visual “strength/weakness” graph. Imagine a bar chart for each insurer with arrows: some green (pointing upward for positive effects) and some red (downward for negative effects), summing to the final ECR. For Ideal and Bayerische, you see several sizable green bars and only small red ones. For Heidelberger, there are a few huge green bars but also two gigantic red bars representing those technical reserves, explaining its net position.
Importantly, economic capital (ECR) is boosted by anything that increases available capital (equity, undistributed profit, etc.) or lowers required capital, and it’s reduced by anything that increases liabilities or strain (like high reserves or debt). All insurers deal with this balance. The top performers find ways to maximize the positives (strong profits, extra reserves that count as capital) and minimize the negatives (either by shedding guaranteed business or offsetting it with capital).
Behind the Numbers: What the Model Tells Us
RealRate’s rating model doesn’t rely on subjective opinions; it’s a data-driven analysis of financial statements. It considers dozens of features – from basic ones like total assets and equity, to nuanced ones like Bestandsabbaurate (policy run-off rate) or Zinszusatzreserve (additional interest reserve).
So, which features matter the most for success? The feature importance analysis ranks variables by how much they influence the ECR across the industry. Unsurprisingly, measures of capital and surplus dominate. For instance, HGB Equity (statutory equity) and the interest-related reserves are very influential. On an importance chart, you’d see 100% assigned to the overall economic capital (since that’s the target outcome). Major contributors under that are things like: HGB equity accounts for roughly 47% of the variance in ECR outcomes, the size of the additional interest reserve (ZZR) explains over 30%, and the expected future surplus distributions (both to policyholders and shareholders) take well over 50% combined. By contrast, smaller items – e.g., subordinated liabilities or minor provisions – barely move the needle for most companies, and thus show very low importance scores. In short, the model confirms that the health of a life insurer boils down to having strong equity and reserves relative to obligations. If an insurer’s capital is thin, no minor tweak will save its ECR; conversely, large hidden reserves and future profits can elevate an insurer significantly.

Figure 3: Feature importance hierarchy (industry-wide). This diagram illustrates how various financial factors contribute to the Economic Capital Ratio. Each percentage indicates the contribution of that factor to explaining differences in ECR. (For example, “HGB-Eigenkapital 47%” means nearly half of the variation in ECR is linked to differences in book equity levels.) The higher up, the more critical the feature. We see that equity and reserves (the blocks at top) are by far the most impactful, whereas features further down (smaller percentages) are of lesser importance. In essence, capital and major reserves are the key drivers of insurers’ ratings.
Another lens is the feature distribution across companies. An industry feature distribution chart shows, for each variable, how many companies have a high or low effect from it. For example, nearly all insurers have some positive contribution from their base equity – that bar is full, indicating it’s a common factor (every insurer has some equity, after all!). On the other hand, not many companies have, say, significant Genussrechte (participation rights) or nachrangige Verbindlichkeiten (subordinated debt); those bars are short – few firms’ ECRs are materially affected by those. What stands out in the distribution is that most insurers are affected by the same big-ticket items: almost everyone has to grapple with the interest rate reserve (ZZR) and the main life liability reserves, as well as asset valuation reserves. The difference is degree: some carry much more of a burden (those show up as outliers on the chart – e.g., one company with extremely high “Deckungsrückstellung” effect, which is Heidelberger). Features like unit-linked business vary: a subset of insurers specialize in that (for them it’s a big positive), whereas many have only small unit-linked portfolios (little effect).
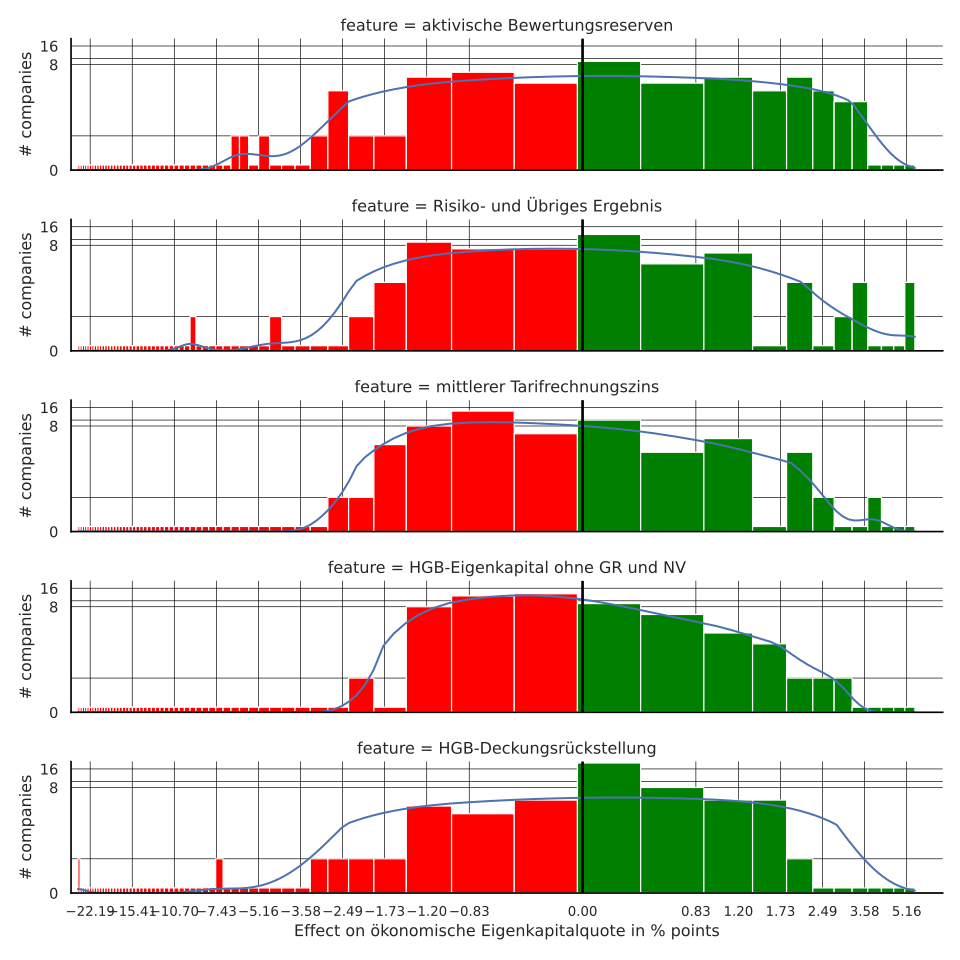
Figure 4: Distribution of key feature effects across all companies. Each bar corresponds to a specific financial feature, and its height indicates how many insurers exhibit a notable effect (positive or negative) from that feature. For instance, the tall bars for core features like Equity or Technical Reserves show that most companies are impacted by these (to varying extents), whereas very short bars for things like Genussrechte indicate that only a few insurers have those instruments affecting their ECR. This chart helps identify which financial metrics are commonly significant in the industry versus which are more niche.
One reassuring output of RealRate’s model is the regression (backtesting) plot, which essentially validates the model’s accuracy. It plots each insurer’s predicted ECR against the actual ECR, checking how closely they line up. The points in the 2025 scatterplot form a tight cluster along the 45° diagonal line, meaning the model’s predictions are very close to reality for most companies. The correlation appears very high (nearly all points hugging the line with only minor deviations). There are a few mild outliers – for example, companies with unusual one-offs like Helvetia may appear slightly off the line, but even those are not far. This strong alignment indicates that the chosen features indeed explain the differences in ECR well. In practical terms, the RealRate model can almost reconstruct an insurer’s economic capital ratio from its balance sheet metrics with high precision, giving confidence in the rankings. If we highlight a specific company (say, Ideal Leben) on this plot, it would appear as a red dot right near the top of the pack, sitting almost exactly on the diagonal – showing that Ideal’s combination of financial traits leads exactly to its high ECR as predicted.
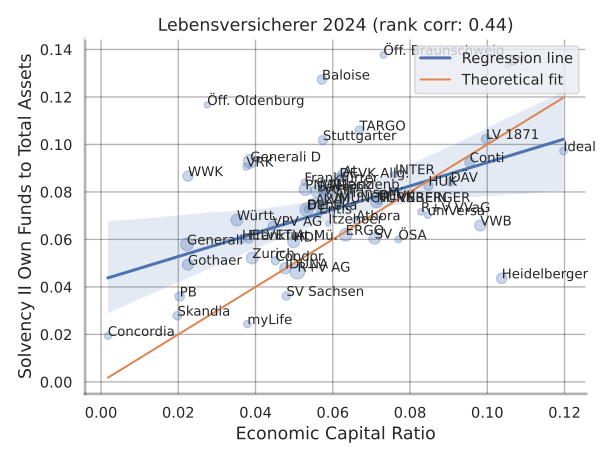
Figure 5: Backtesting regression plot for the model. Each blue dot represents an insurer, with the X-axis being the model’s predicted ECR and the Y-axis the actual ECR. The closer the dots lie to the diagonal line, the better the model prediction. We observe a tight clustering along the line, indicating a very strong correlation between model predictions and actual outcomes. (In a company-specific version of this chart, the subject company’s dot would be highlighted in red – for example, Ideal Leben’s data point sits in the upper right, showing high predicted and actual ECR.) This means the model captures the relationship between the input features and the capital ratio extremely well.
Outlook: A Healthy Competition and Trends to Watch
The 2025 German life insurance ratings show an industry in flux but overall stability at the top. The total market remains robust in size – premiums in the €90–100 billion range – yet the average insurer’s capital buffer is moderate. The fact that only a handful of insurers boast ECRs above 10% indicates potential for consolidation or the need for capital boosts among weaker players. Indeed, companies near the bottom (some with ECR well under 1%) may face pressure to shore up capital or merge, as they operate with razor-thin safety margins. Regulators and customers alike prefer insurers to have comfortable buffers.
For consumers, these rankings are a useful indicator of financial stability. A higher ECR suggests an insurer is well-equipped to fulfill long-term promises (like paying pensions or life policy payouts many years ahead). All top 10 insurers in 2025 have ECRs around 8% or higher, which is a positive sign in terms of solvency strength above regulatory minimums.
What might change moving forward? A few trends stand out:
- Interest Rate Environment: As seen with Heidelberger and others, rising interest rates have a complex impact. On one hand, they relieve some reserve strain (good for capital), but on the other hand, they can erode market values of bonds (bad for asset reserves). The net effect can differ by insurer. If rates continue to increase, expect run-off specialists to potentially gain further (releasing reserves), whereas those with large bond portfolios might need to recognize losses. The model will accordingly reflect these in future ECR changes.
- Product Mix Shifts: Insurers focusing on unit-linked products transfer risk to policyholders, which tends to improve their ECR. We might see more companies pivoting to offer unit-linked life insurance or other capital-light products, thus improving their capital ratios. For instance, if a lower-ranked traditional insurer were to reorient to more unit-linked business, their RealRate indicators could improve. The feature distribution analysis suggests that currently only a minority fully exploit this – so there’s room for change.
- Consolidation of Legacy Portfolios: The dramatic case of Heidelberger Leben hints that more companies might offload legacy books to run-off vehicles. If they do, the purchasing run-off company may initially see a dip (taking on huge reserves) but over time can release capital as they manage those policies out. It’s a long game that can bump an entity up the rankings eventually (as Heidelberger’s spike showed).
- Regulatory and Accounting Changes: The industry recently moved to Solvency II and now IFRS 17 for accounting. While RealRate uses an economic model not tied to any single accounting system, these changes can still affect reported surplus and reserves. Companies that adapt well (e.g., accurately valuing insurance liabilities and not over-distributing profits) will maintain higher ECRs. The importance of future profits in the model implies that profit-sharing policies and how much is retained vs. paid out as bonuses can influence the ratings.
In conclusion, 2025’s life insurance ranking confirms that prudent financial management pays off. Ideal Leben, Bayerische Vorsorge, and Heidelberger Leben each found different pathways to excel, but all underscore the same principle: maintain strong capital relative to commitments. The industry is generally sound – no major player appears to be on the brink – but the gap between the best and the rest is significant. That gap can close if others emulate the leaders’ strategies, whether that means injecting capital, adjusting product focus, or cutting costs to boost profitability (and hence capital). For consumers and brokers, the RealRate rankings offer a transparent, up-to-date window into insurers’ financial health beyond just credit ratings or regulatory solvency ratios. And for the companies themselves, it’s a bit of healthy competition – a challenge to move up by strengthening their balance sheets.
The German life insurance sector in 2025 is a mix of traditional insurers adapting to new realities and agile players seizing opportunities. It will be fascinating to watch whether the current top three can hold onto their throne in the coming years or if we’ll see another shake-up in the leaderboard – perhaps a former giant reclaiming glory or a new dark horse rising with an innovative approach to capital management. One thing is clear: in life insurance, as in life itself, strength comes from within – in this case, within the balance sheet.